

Chapter 5 Data Handling (Class 6 - Maths NCERT Exemplar Solutions)
Welcome to the comprehensive resource for NCERT Exemplar Solutions for Class 6 Mathematics: Chapter 5 Data Handling! This page is designed to provide detailed guidance on organizing, representing, and interpreting information. These Exemplar problems are specifically crafted to be more challenging than standard exercises, pushing students toward a deeper level of data literacy and strengthening their ability to analyze complex datasets with a discerning eye.
The solutions cover essential techniques for organizing raw data systematically. A primary focus is the use of tally marks for efficient counting, where each data point is recorded with a stroke ($||||$) and groups of five are bundled (represented as $\bcancel{||||}$) to create accurate frequency distribution tables. Students will also master the construction and interpretation of pictographs and bar graphs. This involves making critical decisions such as choosing an appropriate scale for the axes, ensuring uniform width and spacing of bars, and providing correct labels and titles to ensure clarity.
Beyond procedural skills, the Exemplar emphasizes the ability to critically analyze information. Our solutions address various question formats including Multiple Choice Questions (MCQs), True/False statements, and long-answer questions that require drawing logical inferences from complex representations. Whether it is identifying trends in a bar graph or calculating total frequencies from a pictograph, these step-by-step solutions prepared by learningspot.co help students develop the analytical skills and logical reasoning necessary for success in higher-level statistics.
| Content On This Page | ||
|---|---|---|
| Solved Examples (Examples 1 to 5) | Question 1 to 5 (Multiple Choice Questions) | Question 6 to 13 (True or False) |
| Question 14 to 21 (Fill in the Blanks) | Question 22 to 55 | |
Solved Examples (Examples 1 to 5)
Write the correct answer from the given four options:
Example 1: Using tally marks which one of the following represents the number five?
(A) $|||||$
(B) $\sqrt{} \sqrt{} \sqrt{} \sqrt{} \sqrt{}$
(C) $\bcancel{|||}|$
(D) $\bcancel{||||}$
Answer:
Solution:
In data handling, tally marks are used to count the frequency of data. A single vertical line represents $1$, and for every $5^{th}$ count, a diagonal line is drawn across the previous $4$ vertical lines.
Therefore, the number five is represented as (D) $\bcancel{||||}$.
Example 2: State whether the following statements are true or false:
(a) A tabular form of data is also a pictorial representation of the data.
(b) A pictograph represents data in the form of pictures of objects or parts of objects.
Answer:
Solution:
(a) False. A tabular form represents data in rows and columns using numbers or text, whereas a pictorial representation (like pictographs or bar graphs) uses images or diagrams.
(b) True. By definition, a pictograph uses icons or pictures of objects (or fractions of them) to represent the frequency of data.
Example 3: The blood groups of 25 students are recorded as under:
| A | B | O | A | AB | O | A | O | B | A |
| O | B | A | AB | AB | A | A | B | B | O |
| B | AB | O | A | B |
Arrange the information in a table using tally marks.
Answer:
Given:
Blood groups of $25$ students.
Solution:
We count the occurrence of each blood group and represent it using tally marks and frequency.
| Blood Group | Tally Marks | Number of Students (Frequency) |
| A | $\bcancel{||||} |||$ | $8$ |
| B | $\bcancel{||||} ||$ | $7$ |
| O | $\bcancel{||||} |$ | $6$ |
| AB | $||||$ | $4$ |
| Total | $25$ |
Example 4: In a school, there are five sections of Class VI. The number of students in each section is given below:
| Section | A | B | C | D | E |
|---|---|---|---|---|---|
| Number of students | 40 | 44 | 42 | 36 | 32 |
Represent the above data using a bar graph.
Answer:
Solution:
To represent the data using a bar graph, we follow these steps:
1. Draw two perpendicular lines (Horizontal axis for Sections and Vertical axis for Number of Students).
2. Choose an appropriate scale for the vertical axis. Let $1$ unit length = $5$ students.
3. Draw bars of equal width with equal gaps between them.
Scale: $1$ unit = $5$ students.
Example 5: The number of vistors in a science exhibition on different days of a week is shown below:
Look at the above pictograph and answer the following questions:
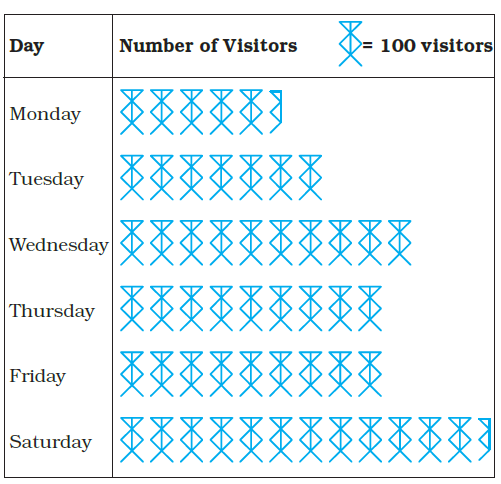
(a) What is the total number of visitors from Monday to Saturday?
(b) On which day was the number of visitors maximum? What was their total number?
(c) On which day was the number of visitors minimum?
(d) On which day was the number of visitors same as the number of visitors on two days taken together?
Answer:
Given:
According to the provided data and the pictograph scale:
Scale: $1$ full symbol = $100$ visitors, and $1$ half symbol = $50$ visitors.
Step 1: Calculate the number of visitors for each day
| Day | Number of Symbols | Calculation | Total Visitors |
| Monday | $5 \frac{1}{2}$ | $5 \times 100 + 50$ | $550$ |
| Tuesday | $7$ | $7 \times 100$ | $700$ |
| Wednesday | $10$ | $10 \times 100$ | $1000$ |
| Thursday | $9$ | $9 \times 100$ | $900$ |
| Friday | $9$ | $9 \times 100$ | $900$ |
| Saturday | $12 \frac{1}{2}$ | $12 \times 100 + 50$ | $1250$ |
(a) Total number of visitors from Monday to Saturday:
To find the total, we add the visitors of all six days:
Total = $550 + 700 + 1000 + 900 + 900 + 1250$
The total number of visitors is $5300$.
(b) Day with maximum visitors and their number:
Comparing the values: $550, 700, 1000, 900, 900, 1250$.
The highest value is $1250$.
The number of visitors was maximum on Saturday, and the total number was $1250$.
(c) Day with minimum visitors:
Comparing the values: $550, 700, 1000, 900, 900, 1250$.
The lowest value is $550$.
The number of visitors was minimum on Monday.
(d) Day with visitors equal to two other days taken together:
We need to find a day whose visitor count equals the sum of visitors on two other days.
Let's add the visitors of Monday and Tuesday:
$\text{Monday} + \text{Tuesday} = 550 + 700 = 1250$
As calculated in Step 1, the number of visitors on Saturday is $1250$.
Therefore, on Saturday, the number of visitors was same as the number of visitors on Monday and Tuesday taken together.
Exercise
Question 1 to 5 (Multiple Choice Questions)
In questions 1 to 5, out of the four options, only one is correct. write the correct answer.
Question 1. Using tally marks, which one of the following represents the number eight:
(A) $|||||$ $|||$
(B) $\bcancel{|||}$ $\bcancel{|||}$
(C) $\bcancel{|||||}$ $||$
(D) $\bcancel{||||}$ $|||$
Answer:
Solution:
In data handling, the standard system for tally marks is to represent every $5^{th}$ count with a diagonal line across four vertical lines.
For the number $8$, we can break it down as $5 + 3$.
1. The number $5$ is represented by four vertical bars and one diagonal bar: $\bcancel{||||}$
2. The remaining $3$ is represented by three vertical bars: $|||$
Combining these, we get: $\bcancel{||||}$ $|||$
Correct Option: (D)
Question 2. The marks (out of 10) obtained by 28 students in a Mathematics test are listed as below:
| 8 | 1 | 2 | 6 | 5 | 5 | 5 | 0 | 1 | 9 |
| 7 | 8 | 0 | 5 | 8 | 3 | 0 | 8 | 10 | 10 |
| 3 | 4 | 8 | 7 | 8 | 9 | 2 | 0 |
The number of students who obtained marks more than or equal to 5 is
(A) 13
(B) 15
(C) 16
(D) 17
Answer:
To Find:
Number of students who obtained marks $\geq 5$.
Solution:
We need to count the students whose marks are $5, 6, 7, 8, 9$ or $10$. Let us scan the given list:
Row 1: $8, 6, 5, 5, 5, 9$ (Count = 6)
Row 2: $7, 8, 5, 8, 8, 10, 10$ (Count = 7)
Row 3: $8, 7, 8, 9$ (Count = 4)
Total number of students = $6 + 7 + 4 = 17$
Correct Option: (D)
Question 3. In question 2 above, the number of students who scored marks less than 4 is
(A) 15
(B) 13
(C) 12
(D) 10
Answer:
To Find:
Number of students who scored marks $< 4$.
Solution:
We need to count the students whose marks are $0, 1, 2$ or $3$. Let us scan the list from Question 2:
Row 1: $1, 2, 0, 1$ (Count = 4)
Row 2: $0, 3, 0$ (Count = 3)
Row 3: $3, 2, 0$ (Count = 3)
Total number of students = $4 + 3 + 3 = 10$
Correct Option: (D)
Question 4. The choices of the fruits of 42 students in a class are as follows:
| A | O | B | M | A | G | B | G | A | G |
| B | M | A | G | M | A | B | G | M | B |
| A | O | M | O | G | B | O | M | G | A |
| A | B | M | O | M | G | B | A | M | O |
| M | O |
where A, B, G, M and O stand for the fruits Apple, Banana, Grapes, Mango and Orange respectively.
Which two fruits are liked by an equal number of students?
(A) A and M
(B) M and B
(C) B and O
(D) B and G
Answer:
Solution:
First, we construct a frequency distribution table to count how many students like each fruit.
| Fruit | Tally Marks | Number of Students |
| Apple (A) | $\bcancel{||||}$ $||||$ | $9$ |
| Banana (B) | $\bcancel{||||}$ $|||$ | $8$ |
| Grapes (G) | $\bcancel{||||}$ $|||$ | $8$ |
| Mango (M) | $\bcancel{||||}$ $\bcancel{||||}$ | $10$ |
| Orange (O) | $\bcancel{||||}$ $||$ | $7$ |
| Total | 42 |
From the table, we observe that Banana (B) and Grapes (G) are both liked by $8$ students.
Correct Option: (D)
Question 5. According to data of question 4, which fruit is liked by most of the students?
(A) O
(B) G
(C) M
(D) A
Answer:
Solution:
Referring to the frequency table constructed in the previous solution:
1. Apple: $9$ students
2. Banana: $8$ students
3. Grapes: $8$ students
4. Mango: $10$ students
5. Orange: $7$ students
The maximum number of students ($10$) like Mango (M).
Correct Option: (C)
Question 6 to 13 (True or False)
In questions 6 to 13, state whether the given statements are true (T) or false (F).
Question 6. In a bar graph, the width of bars may be unequal.
Answer:
Solution:
False. In a bar graph, the width of all bars must be uniform (equal). It is the height (or length) of the bars that varies to represent the numerical value of the data.
Question 7. In a bar graph, bars of uniform width are drawn vertically only.
Answer:
Solution:
False. In a bar graph, bars can be drawn both vertically or horizontally, as long as they are of uniform width and have equal spacing between them.
Question 8. In a bar graph, the gap between two consecutive bars may not be thesame.
Answer:
Solution:
False. In a standard bar graph, the gaps between consecutive bars must be equal to ensure the data is represented clearly and professionally.
Question 9. In a bar graph, each bar (rectangle) represents only one value of the numerical data.
Answer:
Solution:
True. Each bar corresponds to a specific category, and its height or length represents exactly one numerical value from the dataset.
Question 10. To represent the population of different towns using bar graph, it isconvenient to take one unit length to represent one person.
Answer:
Solution:
False. Populations of towns are usually very large numbers (often in thousands or lakhs). Taking $1$ unit = $1$ person would result in an impossibly long graph. It is more convenient to take a scale like $1$ unit = $1000$ or $10,000$ people.
Question 11. Pictographs and bar graphs are pictorial representations of the numerical data.
Answer:
Solution:
True. Both pictographs (using symbols) and bar graphs (using rectangular bars) use visual elements to display data, making them pictorial representations.
Question 12. An observation occurring five times in a data is recorded as | | | | | , using tally marks.
Answer:
Solution:
False. According to the standard tally mark system, the number $5$ is recorded by four vertical lines and a diagonal line crossing them, represented as $\bcancel{||||}$.
Question 13. In a pictograph, if a symbol  represents 50 books in a library shelf, then the symbol
  represents 25 books.
Answer:
Solution:
True. In a pictograph, a half-symbol represents half the value of the full symbol. Since half of $50$ is $25$, the statement is correct.
Question 14 to 21 (Fill in the Blanks)
In questions 14 to 21, fill in the blanks to make the statements true:
Question 14. A _______ is a collection of numbers gathered to give some meaningful information.
Answer:
A data is a collection of numbers gathered to give some meaningful information. In statistics, data serves as the raw material for analysis. When we collect information like heights of students or marks in a test, the organized set of these numbers is called data.
Question 15. The data can be arranged in a tabular form using _______ marks.
Answer:
The data can be arranged in a tabular form using tally marks. Tally marks are a quick way of keeping track of numbers in groups of five, making it easier to count large sets of data without losing track.
Question 16. A _______ represents data through pictures of objects.
Answer:
A pictograph represents data through pictures of objects. For example, if we want to show the number of cars sold, we might use a small car icon where each icon represents $10$ or $100$ actual cars. This makes the data visually appealing and easy to understand at a glance.
Question 17. In a bar graph, ________ can be drawn horizontally or vertically.
Answer:
In a bar graph, bars can be drawn horizontally or vertically. While vertical bar graphs are more common in school textbooks, horizontal bar graphs are equally valid and are often used when the category names (labels) are very long.
Question 18. In a bar graph, bars of ________ width can be drawn horizontally or vertically with ________ spacing between them.
Answer:
In a bar graph, bars of uniform width can be drawn horizontally or vertically with equal spacing between them. Uniform width and equal spacing are essential because a bar graph is a visual tool for comparison. If widths or gaps vary, it can mislead the viewer regarding the actual proportions of the data.
Question 19. An observation occurring seven times in a data is represented as ________ using tally marks.
Answer:
An observation occurring seven times in a data is represented as $\bcancel{||||}$$||$ using tally marks.
The calculation is based on the grouping of five:
$7 = 5 + 2$
Where $5$ is represented as $\bcancel{||||}$ and the remaining $2$ is represented as $||$.
Question 20. In a pictograph, if a symbol  represents 20 flowers in a basket then
  stands for ________ flowers.
Answer:
Given:
One symbol = $20$ flowers.
To Find:
The value of three symbols .
Solution:
Since there are $3$ identical symbols, we multiply the value of one symbol by $3$:
Therefore, the three symbols stand for $60$ flowers.
Question 21. On the scale of 1 unit length = 10 crore, the bar of length 6 units will represent ________ crore and of ______ units will represent 75 crore.
Answer:
Given:
Scale: $1$ unit length = $10$ crore.
To Find:
1. Value of $6$ units.
2. Number of units for $75$ crore.
Solution:
For the first part:
Value = Length $\times$ Scale
Value = $6 \times 10 = 60$ crore.
For the second part:
Length = $\frac{\text{Total Value}}{\text{Scale}}$
Length = $\frac{75}{10}$
Therefore, a bar of length $6$ units represents $60$ crore and a bar of $7.5$ units will represent $75$ crore.
Question 22 to 55
Question 22. In an examination, the grades achieved by 30 students of a class are given below. Arrange these grades in a table using tally marks:
| B | C | C | E | A | C | B | B | D | D |
| D | D | B | C | C | C | A | C | B | E |
| A | D | C | B | E | C | B | E | C | D |
Answer:
Given:
Grades of $30$ students in an examination.
To Find:
Arrange the data in a table using tally marks.
Solution:
By counting the frequency of each grade from the given data, we get the following table:
| Grade | Tally Marks | Number of Students (Frequency) |
| A | $|||$ | $3$ |
| B | $\bcancel{||||} ||$ | $7$ |
| C | $\bcancel{||||} \bcancel{||||}$ | $10$ |
| D | $\bcancel{||||} |$ | $6$ |
| E | $||||$ | $4$ |
| Total | $30$ |
Question 23. The number of two wheelers owned individually by each of 50 families are listed below. Make a table using tally marks.
| 1 | 1 | 2 | 1 | 1 | 1 | 2 | 1 | 2 | 1 |
| 0 | 1 | 1 | 2 | 3 | 1 | 2 | 1 | 1 | 2 |
| 1 | 2 | 3 | 1 | 0 | 2 | 1 | 0 | 2 | 1 |
| 2 | 1 | 2 | 1 | 1 | 4 | 1 | 3 | 1 | 1 |
| 2 | 1 | 1 | 1 | 1 | 2 | 3 | 2 | 1 | 1 |
Find the number of families having two or more, two wheelers.
Answer:
Given:
Number of two-wheelers owned by $50$ families.
To Find:
1. Frequency table using tally marks.
2. Number of families having $2$ or more two-wheelers.
Solution:
| Number of Two Wheelers | Tally Marks | Number of Families (Frequency) |
| 0 | $|||$ | $3$ |
| 1 | $\bcancel{||||} \bcancel{||||} \bcancel{||||} \bcancel{||||} \bcancel{||||} |||$ | $28$ |
| 2 | $\bcancel{||||} \bcancel{||||} ||||$ | $14$ |
| 3 | $||||$ | $4$ |
| 4 | $|$ | $1$ |
| Total | $50$ |
To find the number of families having two or more two-wheelers, we add the frequencies for $2, 3,$ and $4$ two-wheelers:
Number of families = $14$ (for 2) + $4$ (for 3) + $1$ (for 4)
Number of families = $19$
Conclusion: There are $19$ families having two or more two-wheelers.
Question 24. The lengths in centimetres (to the nearest centimetre) of 30 carrots are given as follows:
| 15 | 22 | 21 | 20 | 22 | 15 | 15 | 20 | 20 | 15 |
| 20 | 18 | 20 | 22 | 21 | 20 | 21 | 18 | 21 | 18 |
| 20 | 18 | 21 | 18 | 22 | 20 | 15 | 21 | 18 | 20 |
Arrange the data given above in a table using tally marks and answerthe following questions.
(a) What is the number of carrots which have length more than 20 cm?
(b) Which length of the carrots occur maximum number of times? Minimum number of times?
Answer:
Solution:
First, we arrange the carrot lengths in a frequency table:
| Length (in cm) | Tally Marks | Number of Carrots (Frequency) |
| 15 | $\bcancel{||||}$ | $5$ |
| 18 | $\bcancel{||||} |$ | $6$ |
| 20 | $\bcancel{||||} ||||$ | $9$ |
| 21 | $\bcancel{||||} |$ | $6$ |
| 22 | $||||$ | $4$ |
| Total | $30$ |
(a) Number of carrots with length more than 20 cm:
These are carrots with lengths $21$ cm and $22$ cm.
Number of carrots = $6$ (of 21 cm) + $4$ (of 22 cm) = $10$
(b) Maximum and Minimum Occurrences:
1. The length $20$ cm occurs the maximum number of times ($9$ times).
2. The length $22$ cm occurs the minimum number of times ($4$ times).
Question 25. Thirty students were interviewed to find out what they want to be in future. Their responses are listed as below:
| doctor | engineer | doctor | pilot | officer | doctor |
| engineer | doctor | pilot | officer | pilot | engineer |
| officer | pilot | doctor | engineer | pilot | officer |
| doctor | officer | doctor | pilot | engineer | doctor |
| pilot | officer | doctor | pilot | doctor | engineer |
Arrange the data in a table using tally marks.
Answer:
To Find:
A frequency distribution table using tally marks for career responses.
Solution:
| Future Career | Tally Marks | Number of Responses (Frequency) |
| Doctor | $\bcancel{||||} \bcancel{||||}$ | $10$ |
| Engineer | $\bcancel{||||} |$ | $6$ |
| Pilot | $\bcancel{||||} |||$ | $8$ |
| Officer | $\bcancel{||||} |$ | $6$ |
| Total | $30$ |
Conclusion: The data shows that Doctor is the most preferred career choice among the $30$ students interviewed.
Question 26. Following are the choices of games of 40 students of Class VI:
| football | cricket | football | kho-kho | hockey | cricket |
| hockey | kho-kho | tennis | tennis | cricket | football |
| football | hockey | kho-kho | football | cricket | tennis |
| football | hockey | kho-kho | football | cricket | cricket |
| football | hockey | kho-kho | tennis | football | hockey |
| cricket | football | hockey | cricket | football | kho-kho |
| football | cricket | hockey | football |
(a) Arrange the choices of games in a table using tally marks.
(b) Which game is liked by most of the students?
(c) Which game is liked by minimum number of students?
Answer:
To Find:
1. Frequency table for game choices using tally marks.
2. The most liked game.
3. The least liked game.
Solution (a):
After counting the occurrences of each game from the given data, we arrange them in the table below:
| Game | Tally Marks | Number of Students (Frequency) |
| Football | $\bcancel{||||} \bcancel{||||} |||$ | $13$ |
| Cricket | $\bcancel{||||} ||||$ | $9$ |
| Hockey | $\bcancel{||||} |||$ | $8$ |
| Kho-kho | $\bcancel{||||} |$ | $6$ |
| Tennis | $||||$ | $4$ |
| Total | $40$ |
Solution (b):
By looking at the frequency column, the highest number is $13$.
Conclusion: Football is liked by most of the students.
Solution (c):
By looking at the frequency column, the lowest number is $4$.
Conclusion: Tennis is liked by the minimum number of students.
Question 27. Fill in the blanks in the following table which represents shirt size of 40 students of a school.
| Shirt size | Tally Marks | Number of students |
|---|---|---|
| 30 | $|||$ | 3 |
| 32 | $\bcancel{||||}$ | __ |
| 34 | __ | 8 |
| 36 | $\bcancel{||||} ||$ | __ |
| 38 | $\bcancel{||||}$ ___ | 10 |
| 40 | ___ | 7 |
Answer:
Solution:
We fill the blanks by converting Tally Marks into numbers or numbers into Tally Marks.
1. Size 32: The tally marks are $\bcancel{||||}$, which represents $5$ students.
2. Size 34: The number of students is $8$. This is represented by $5 + 3$, which is $\bcancel{||||} |||$.
3. Size 36: The tally marks are $\bcancel{||||} ||$, which represents $5 + 2 = $ $7$ students.
4. Size 38: The number of students is $10$. This is represented by $5 + 5$, which is $\bcancel{||||} \bcancel{||||}$.
5. Size 40: The number of students is $7$. This is represented by $5 + 2$, which is $\bcancel{||||} ||$.
Final Completed Table:
| Shirt Size | Tally Marks | Number of Students |
| 30 | $|||$ | 3 |
| 32 | $\bcancel{||||}$ | 5 |
| 34 | $\bcancel{||||} |||$ | 8 |
| 36 | $\bcancel{||||} ||$ | 7 |
| 38 | $\bcancel{||||} \bcancel{||||}$ | 10 |
| 40 | $\bcancel{||||} ||$ | 7 |
| Total | 40 |
Question 28. Following pictograph represents some surnames of people listed in the telephone directory of a city
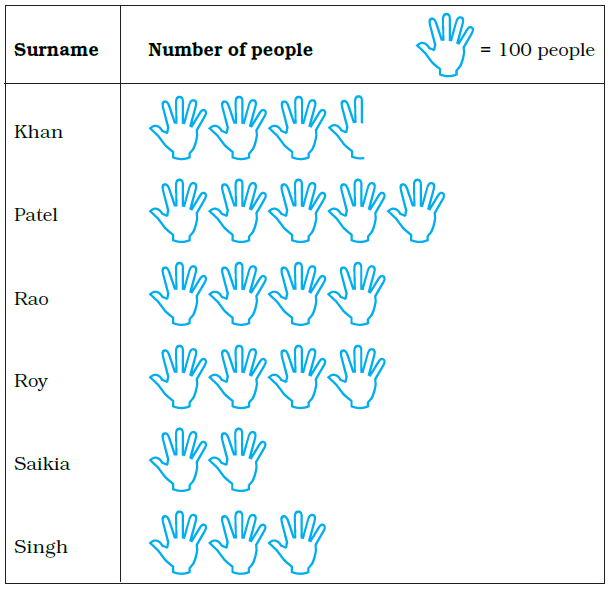
Observe the pictograph and answer the following questions:
(a) How many people have surname ‘Roy’?
(b) Which surname appears the maximum number of times in the telephone directory?
(c) Which surname appears the least number of times in the directory?
(d) Which two surnames appear an equal number of times?
Answer:
Given:
From the pictograph, the scale is provided as:
$1$ full hand symbol = $100$ people.
Since a hand symbol has $5$ fingers, each finger represents $\frac{100}{5} = 20$ people.
Step-by-step Calculation:
First, let us calculate the number of people for each surname based on the symbols shown:
| Surname | Number of Symbols | Calculation | Total People |
| Khan | $3$ full + $1$ partial ($3$ fingers) | $(3 \times 100) + (3 \times 20)$ | $360$ |
| Patel | $5$ full | $5 \times 100$ | $500$ |
| Rao | $4$ full | $4 \times 100$ | $400$ |
| Roy | $4$ full | $4 \times 100$ | $400$ |
| Saikia | $2$ full | $2 \times 100$ | $200$ |
| Singh | $3$ full | $3 \times 100$ | $300$ |
(a) How many people have surname ‘Roy’?
As per the table, the surname Roy has $4$ full hand symbols.
Number of people = $4 \times 100 = 400$.
Conclusion: $400$ people have the surname ‘Roy’.
(b) Which surname appears the maximum number of times?
Comparing the totals: $360, 500, 400, 400, 200, 300$.
The highest value is $500$, which corresponds to the surname Patel.
Conclusion: Surname ‘Patel’ appears the maximum number of times.
(c) Which surname appears the least number of times?
Comparing the totals, the lowest value is $200$, which corresponds to the surname Saikia.
Conclusion: Surname ‘Saikia’ appears the least number of times.
(d) Which two surnames appear an equal number of times?
From the table, both Rao and Roy have exactly $4$ full hand symbols each, totaling $400$ people each.
Conclusion: The two surnames appearing an equal number of times are ‘Rao’ and ‘Roy’.
Question 29. Students of Class VI in a school were given a task to count the number of articles made of different materials in the school. The information collected by them is represented as follows:
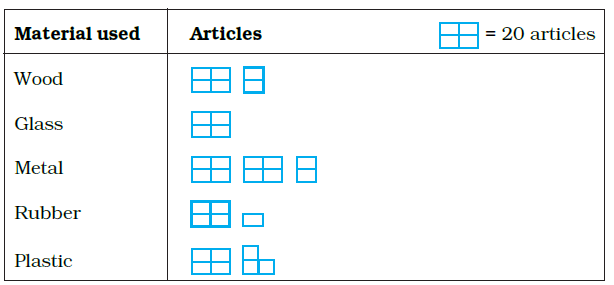
Observe the pictograph and answer the following questions:
(a) Which material is used in maximum number of articles?
(b) Which material is used in minimum number of articles?
(c) Which material is used in exactly half the number of articles as those made up of metal?
(d) What is the total number of articles counted by the students?
Answer:
Given:
From the pictograph, the scale is given as:
$1$ full square symbol (containing $4$ small squares) = $20$ articles.
This means each small square represents: $\frac{20}{4} = 5$ articles.
Step 1: Calculate the number of articles for each material
| Material | Symbol Description | Calculation | Number of Articles |
| Wood | $1$ full + $2$ small squares | $20 + (2 \times 5)$ | $30$ |
| Glass | $1$ full symbol | $1 \times 20$ | $20$ |
| Metal | $2$ full + $2$ small squares | $(2 \times 20) + (2 \times 5)$ | $50$ |
| Rubber | $1$ full + $1$ small square | $20 + 5$ | $25$ |
| Plastic | $1$ full + $3$ small squares | $20 + (3 \times 5)$ | $35$ |
(a) Which material is used in maximum number of articles?
Comparing the values: $30, 20, 50, 25, 35$.
The highest value is $50$, which belongs to Metal.
Conclusion: Metal is used in the maximum number of articles.
(b) Which material is used in minimum number of articles?
The lowest value in the data is $20$, which belongs to Glass.
Conclusion: Glass is used in the minimum number of articles.
(c) Which material is used in exactly half the number of articles as those made up of metal?
Number of articles made of metal = $50$
Half of this number = $\frac{50}{2} = 25$
Looking at our table, Rubber has exactly $25$ articles.
Conclusion: Rubber is used in exactly half the number of articles as those made up of metal.
(d) What is the total number of articles counted by the students?
Total = $30 + 20 + 50 + 25 + 35$
Conclusion: The total number of articles counted by the students is $160$.
Question 30. The number of scouts in a school is depicted by the following pictograph:
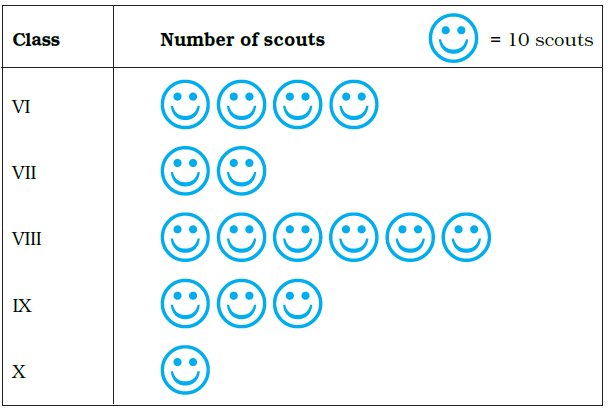
Observe the pictograph and answer the following questions:
(a) Which class has the minimum number of scouts?
(b) Which class has the maximum number of scouts?
(c) How many scouts are there in Class VI?
(d) Which class has exactly four times the scouts as that of Class X?
(e) What is the total number of scouts in the Classes VI to X?
Answer:
Given:
From the pictograph, the scale is:
$1$ smiley symbol = $10$ scouts
To Find:
Answers to sub-questions (a) to (e) based on the observation of the pictograph.
Solution:
First, let us calculate the number of scouts in each class based on the given scale:
| Class | Number of Symbols | Calculation | Number of Scouts |
| VI | $4$ | $4 \times 10$ | $40$ |
| VII | $2$ | $2 \times 10$ | $20$ |
| VIII | $6$ | $6 \times 10$ | $60$ |
| IX | $3$ | $3 \times 10$ | $30$ |
| X | $1$ | $1 \times 10$ | $10$ |
(a) Which class has the minimum number of scouts?
Comparing the values: $40, 20, 60, 30, 10$.
The smallest value is $10$, which belongs to Class X.
Conclusion: Class X has the minimum number of scouts.
(b) Which class has the maximum number of scouts?
The largest value in the data is $60$, which belongs to Class VIII.
Conclusion: Class VIII has the maximum number of scouts.
(c) How many scouts are there in Class VI?
Class VI has $4$ symbols.
$\text{Scouts in Class VI} = 4 \times 10$
$= 40$
Conclusion: There are $40$ scouts in Class VI.
(d) Which class has exactly four times the scouts as that of Class X?
Number of scouts in Class X = $10$
Four times the scouts of Class X = $4 \times 10 = 40$
Looking at our calculations, Class VI has $40$ scouts.
Conclusion: Class VI has exactly four times the scouts as that of Class X.
(e) What is the total number of scouts in the Classes VI to X?
We add the scouts of all classes together:
Total = $40 + 20 + 60 + 30 + 10$
Conclusion: The total number of scouts in Classes VI to X is $160$.
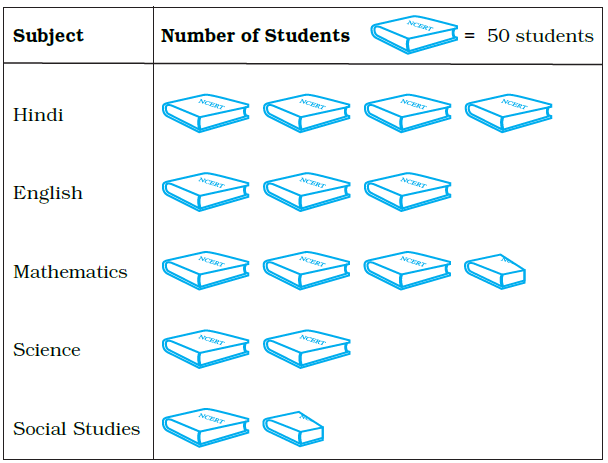
Question 31. A survey was carried out in a certain school to find out the popular school subjects among students of Classes VI to VIII. The data in this regard is displayed as pictograph given below:
(a) Which subject is most popular among the students?
(b) How many students like Mathematics?
(c) Find the number of students who like subjects other than Mathematics and Science.
Answer:
Given:
Scale of the pictograph: $1$ full book symbol = $50$ students. Therefore, $1$ half book symbol = $25$ students.
Step 1: Calculate the number of students for each subject
| Subject | Number of Symbols | Calculation | Number of Students |
| Hindi | $4$ full | $4 \times 50$ | $200$ |
| English | $3$ full | $3 \times 50$ | $150$ |
| Mathematics | $3$ full + $1$ half | $(3 \times 50) + 25$ | $175$ |
| Science | $2$ full | $2 \times 50$ | $100$ |
| Social Studies | $1$ full + $1$ half | $50 + 25$ | $75$ |
(a) Which subject is most popular among the students?
Comparing the number of students: $200, 150, 175, 100, 75$.
The maximum number of students ($200$) like Hindi.
Conclusion: Hindi is the most popular subject among the students.
(b) How many students like Mathematics?
From the table, the number of symbols for Mathematics is $3$ full and $1$ half.
Number of students = $3 \times 50 + 25 = 150 + 25 = 175$.
Conclusion: $175$ students like Mathematics.
(c) Find the number of students who like subjects other than Mathematics and Science.
Subjects other than Mathematics and Science are Hindi, English, and Social Studies.
Total students = $\text{Hindi} + \text{English} + \text{Social Studies}$
Total students = $200 + 150 + 75$
Conclusion: There are $425$ students who like subjects other than Mathematics and Science.
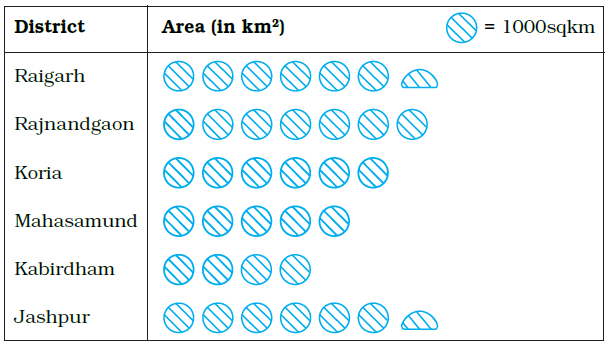
Question 32. The following pictograph depicts the information about the areas in sqkm (to nearest hundred) of some districts of Chhattisgarh State:
(a) What is the area of Koria district?
(b) Which two districts have the same area?
(c) How many districts have area more than 5000 square kilometres?
Answer:
Given:
From the pictograph, the scale provided is:
$1$ full circle symbol = $1000$ sq km
Therefore, $1$ half circle symbol = $500$ sq km
Step-by-step Calculation:
Let us calculate the total area for each district listed in the pictograph:
| District | Number of Symbols | Calculation | Area (in sq km) |
| Raigarh | $6$ full + $1$ half | $(6 \times 1000) + 500$ | $6500$ |
| Rajnandgaon | $7$ full | $7 \times 1000$ | $7000$ |
| Koria | $6$ full | $6 \times 1000$ | $6000$ |
| Mahasamund | $5$ full | $5 \times 1000$ | $5000$ |
| Kabirdham | $4$ full | $4 \times 1000$ | $4000$ |
| Jashpur | $6$ full + $1$ half | $(6 \times 1000) + 500$ | $6500$ |
(a) What is the area of Koria district?
From the table above, Koria district has $6$ full circle symbols.
Area of Koria = $6 \times 1000 = 6000$ sq km.
Conclusion: The area of Koria district is $6000$ sq km.
(b) Which two districts have the same area?
Looking at the calculated areas:
Raigarh = $6500$ sq km
Jashpur = $6500$ sq km
Conclusion: Raigarh and Jashpur have the same area.
(c) How many districts have area more than 5000 square kilometres?
We need to find districts where the area is greater than $5000$ sq km:
1. Raigarh ($6500$ sq km) $>$ $5000$ sq km
2. Rajnandgaon ($7000$ sq km) $>$ $5000$ sq km
3. Koria ($6000$ sq km) $>$ $5000$ sq km
4. Jashpur ($6500$ sq km) $>$ $5000$ sq km
Note: Mahasamund is exactly $5000$ sq km, so it is not included in "more than 5000".
Conclusion: There are $4$ districts (Raigarh, Rajnandgaon, Koria, and Jashpur) that have an area more than $5000$ square kilometres.
Question 33. The number of bottles of cold drinks sold by a shopkeeper on six consecutive days is as follows:
| Day | Sunday | Monday | Tuesday | Wednesday | Thursday | Friday |
|---|---|---|---|---|---|---|
| Number of bottles | 350 | 200 | 300 | 250 | 100 | 150 |
Prepare a pictograph of the data using one symbol to represent 50 bottles.
Answer:
Given:
Number of cold drink bottles sold daily.
Scale: $1$ symbol = $50$ bottles.
Calculation for Pictograph:
We divide the number of bottles by $50$ to find the number of symbols required for each day:
1. Sunday: $\frac{350}{50} = 7$ symbols
2. Monday: $\frac{200}{50} = 4$ symbols
3. Tuesday: $\frac{300}{50} = 6$ symbols
4. Wednesday: $\frac{250}{50} = 5$ symbols
5. Thursday: $\frac{100}{50} = 2$ symbols
6. Friday: $\frac{150}{50} = 3$ symbols
Pictograph:
(Scale: 🥤 = $50$ bottles)
| Sunday: | 🥤 🥤 🥤 🥤 🥤 🥤 🥤 |
| Monday: | 🥤 🥤 🥤 🥤 |
| Tuesday: | 🥤 🥤 🥤 🥤 🥤 🥤 |
| Wednesday: | 🥤 🥤 🥤 🥤 🥤 |
| Thursday: | 🥤 🥤 |
| Friday: | 🥤 🥤 🥤 |
Question 34. The following table gives information about the circulation of newspapers (dailies) in a town in five languages.
| Language | English | Hindi | Tamil | Punjabi | Gujrati |
|---|---|---|---|---|---|
| Number of newspapers | 5000 | 8500 | 500 | 2500 | 1000 |
Prepare a pictograph of the above data, using a symbol of your choice, each representing 1000 newspapers.
Answer:
Given:
Number of newspapers in various languages.
Scale: $1$ symbol = $1000$ newspapers. Thus, a half symbol = $500$ newspapers.
Calculation for Pictograph:
1. English: $\frac{5000}{1000} = 5$ symbols
2. Hindi: $\frac{8500}{1000} = 8.5$ symbols ($8$ full and $1$ half)
3. Tamil: $\frac{500}{1000} = 0.5$ symbols ($1$ half)
4. Punjabi: $\frac{2500}{1000} = 2.5$ symbols ($2$ full and $1$ half)
5. Gujarati: $\frac{1000}{1000} = 1$ symbol
Pictograph:
(Scale: 📰 = $1000$ newspapers)
| English: | 📰 📰 📰 📰 📰 |
| Hindi: | 📰 📰 📰 📰 📰 📰 📰 📰 📰 |
| Tamil: | 📰 |
| Punjabi: | 📰 📰 📰 |
| Gujarati: | 📰 |
Question 35. Annual expenditure of a company in the year 2007-2008 is given below:
| Items | Expenditure (RS in lakh) |
|---|---|
| Salaries of employees | 65 |
| Advertisement | 10 |
| Purchase of machinery | 85 |
| Electricity and water | 15 |
| Transport | 25 |
| Other expenses | 30 |
Prepare a pictograph of the above data using an appropriate symbol to represent Rs 10 lakh.
Answer:
Given:
Expenditure items in $\textsf{₹}$ lakh.
Scale: $1$ symbol = $\textsf{₹} 10$ lakh. Thus, a half symbol = $\textsf{₹} 5$ lakh.
Calculation for Pictograph:
1. Salaries: $\frac{65}{10} = 6.5$ symbols
2. Advertisement: $\frac{10}{10} = 1$ symbol
3. Machinery: $\frac{85}{10} = 8.5$ symbols
4. Electricity/Water: $\frac{15}{10} = 1.5$ symbols
5. Transport: $\frac{25}{10} = 2.5$ symbols
6. Others: $\frac{30}{10} = 3$ symbols
Pictograph:
(Scale: 💰 = $\textsf{₹} 10$ lakh)
| Salaries: | 💰 💰 💰 💰 💰 💰 💰 |
| Advertisement: | 💰 |
| Machinery: | 💰 💰 💰 💰 💰 💰 💰 💰 💰 |
| Electricity/Water: | 💰 💰 |
| Transport: | 💰 💰 💰 |
| Others: | 💰 💰 💰 |
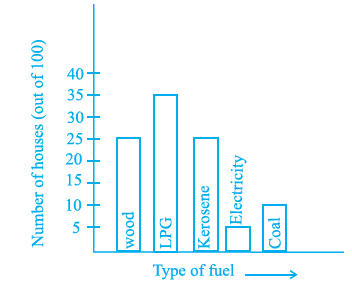
Question 36. The following bar graph shows the number of houses (out of 100) in a town using different types of fuels for cooking.
Read the bar graph and answer the following questions:
Scale: 1 unit length = 5 houses
(a) Which fuel is used in maximum number of houses?
(b) How many houses are using coal as fuel?
(c) Suppose that the total number of houses in the town is 1 lakh. From the above graph estimate the number of houses using electricity.
Answer:
Given:
The bar graph represents fuel usage in $100$ houses. Based on the graph, the data for different fuels is as follows:
| Type of Fuel | Number of Houses (out of $100$) |
| Wood | $25$ |
| LPG | $35$ |
| Kerosene | $25$ |
| Electricity | $5$ |
| Coal | $10$ |
(a) Which fuel is used in maximum number of houses?
Solution:
By observing the bar graph, the height of the bar for LPG is the highest.
Maximum number of houses = $35$
(From the graph)
Therefore, LPG is the fuel used in the maximum number of houses.
(b) How many houses are using coal as fuel?
Solution:
By observing the bar graph, the bar corresponding to Coal reaches the mark of $10$ on the vertical axis.
Thus, the number of houses using coal as fuel is $10$.
(c) Suppose that the total number of houses in the town is 1 lakh. From the above graph estimate the number of houses using electricity.
To Find: Estimated number of houses using electricity out of $1,00,000$ houses.
Solution:
From the graph, the number of houses using electricity out of $100$ houses is $5$.
Total houses in the town = $1 \text{ lakh} = 1,00,000$.
Number of houses using electricity = $\frac{\text{Number of houses using electricity in sample}}{\text{Total sample houses}} \times \text{Total houses in town}$
Number of houses using electricity = $\frac{5}{100} \times 1,00,000$
Number of houses using electricity = $5 \times 1,000$
Number of houses using electricity = $5,000$.
Final Answer:
(a) LPG is used in the maximum number of houses.
(b) $10$ houses are using coal as fuel.
(c) The estimated number of houses using electricity in a town of $1$ lakh houses is $5,000$.
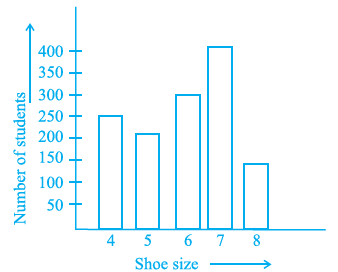
Question 37. The following bar graph represents the data for different sizes of shoes worn by the students in a school. Read the graph and answer the following questions.
Scale : 1 unit length = 50 students
(a) Find the number of students whose shoe sizes have been collected.
(b) What is the number of students wearing shoe size 6?
(c) What are the different sizes of the shoes worn by the students?
(d) Which shoe size is worn by the maximum number of students?
(e) Which shoe size is worn by minimum number of students?
(f) State whether true or false:
The total number of students wearing shoe sizes 5 and 8 is the same as the number of students wearing shoe size 6.
Answer:
Given:
A bar graph showing the shoe sizes of students in a school. Based on the graph and the scale (1 unit length = $50$ students), we can observe the following data:
| Shoe Size | Number of Students |
| 4 | $250$ |
| 5 | $200$ |
| 6 | $300$ |
| 7 | $400$ |
| 8 | $150$ |
(a) Find the number of students whose shoe sizes have been collected.
To Find: The total number of students.
Solution:
The total number of students is the sum of students wearing each shoe size.
$\text{Total Students} = 250 + 200 + 300 + 400 + 150$
Therefore, the total number of students is $1,300$.
(b) What is the number of students wearing shoe size 6?
Solution:
By observing the bar graph, the bar corresponding to shoe size $6$ reaches the $300$ mark on the vertical axis.
Thus, the number of students wearing shoe size $6$ is $300$.
(c) What are the different sizes of the shoes worn by the students?
Solution:
The different sizes of shoes shown on the horizontal axis are $4, 5, 6, 7$ and $8$.
(d) Which shoe size is worn by the maximum number of students?
Solution:
The highest bar in the graph represents the maximum number of students. The bar for shoe size $7$ is the highest ($400$ students).
Therefore, shoe size $7$ is worn by the maximum number of students.
(e) Which shoe size is worn by minimum number of students?
Solution:
The shortest bar in the graph represents the minimum number of students. The bar for shoe size $8$ is the shortest ($150$ students).
Therefore, shoe size $8$ is worn by the minimum number of students.
(f) State whether true or false: The total number of students wearing shoe sizes 5 and 8 is the same as the number of students wearing shoe size 6.
Solution:
First, we find the total number of students wearing shoe sizes $5$ and $8$:
$\text{Students wearing size 5} = 200$
$\text{Students wearing size 8} = 150$
$\text{Sum} = 200 + 150 = 350$
Now, we check the number of students wearing shoe size $6$:
$\text{Students wearing size 6} = 300$
Since $350 \neq 300$, the statement is False.
Final Answer:
(a) The total number of students is $1,300$.
(b) $300$ students wear shoe size 6.
(c) The sizes are $4, 5, 6, 7$ and $8$.
(d) Shoe size $7$ is worn by the maximum number of students.
(e) Shoe size $8$ is worn by the minimum number of students.
(f) False.
Question 38. The following graph gives the information about the number of railway tickets sold for different cities on a railway ticket counter between 6.00 am to 10.00 am. Read the bar graph and answer the following questions.
Scale : 1 unit length = 10 tickets
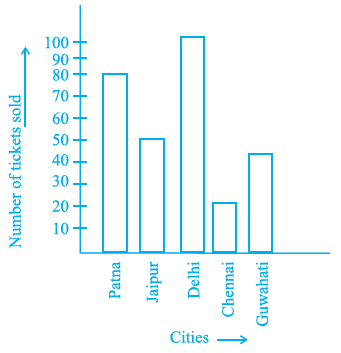
(a) How many tickets were sold in all?
(b) For which city were themaximum number oftickets sold?
(c) For which city were the minimum number of tickets sold?
(d) Name the cities for which the number of tickets sold is more than 20.
(e) Fill in the blanks:
Number of tickets sold for Delhi and Jaipur together exceeds the total number of tickets sold for Patna and Chennai by ______.
Answer:
Given:
The bar graph displays the number of railway tickets sold for various cities. Using the scale $1 \text{ unit length} = 10 \text{ tickets}$, the data is as follows:
| City | Number of Tickets Sold |
| Patna | $80$ |
| Jaipur | $50$ |
| Delhi | $105$ |
| Chennai | $20$ |
| Guwahati | $40$ |
(a) How many tickets were sold in all?
Solution:
To find the total number of tickets sold, we add the tickets sold for all five cities.
$\text{Total tickets} = 80 + 50 + 105 + 20 + 40$
Therefore, a total of $295$ tickets were sold.
(b) For which city were the maximum number of tickets sold?
Solution:
By observing the bar graph, the highest bar corresponds to Delhi, with $105$ tickets sold.
Thus, the maximum number of tickets were sold for Delhi.
(c) For which city were the minimum number of tickets sold?
Solution:
By observing the bar graph, the shortest bar corresponds to Chennai, with $20$ tickets sold.
Thus, the minimum number of tickets were sold for Chennai.
(d) Name the cities for which the number of tickets sold is more than 20.
Solution:
We look for cities where the height of the bar is greater than the $20$ mark.
Tickets sold for Patna = $80$ ($> 20$)
Tickets sold for Jaipur = $50$ ($> 20$)
Tickets sold for Delhi = $105$ ($> 20$)
Tickets sold for Guwahati = $40$ ($> 20$)
Therefore, the cities are Patna, Jaipur, Delhi, and Guwahati.
(e) Number of tickets sold for Delhi and Jaipur together exceeds the total number of tickets sold for Patna and Chennai by ______.
Solution:
First, calculate the sum for Delhi and Jaipur:
$\text{Delhi} + \text{Jaipur} = 105 + 50 = 150$
Next, calculate the sum for Patna and Chennai:
$\text{Patna} + \text{Chennai} = 80 + 20 = 100$
Now, find the difference to see by how much the first group exceeds the second:
$\text{Difference} = 155 - 100$
The number of tickets sold for Delhi and Jaipur together exceeds the total for Patna and Chennai by $55$.
Final Answer:
(a) $290$ tickets.
(b) Delhi.
(c) Chennai.
(d) Patna, Jaipur, Delhi, and Guwahati.
(e) $55$.
Question 39. The bar graph given below represents approximate length (in kilometres) of some National Highways in India. Study the bar graph and answer the following questions:
Scale : 1 unit length = 200km
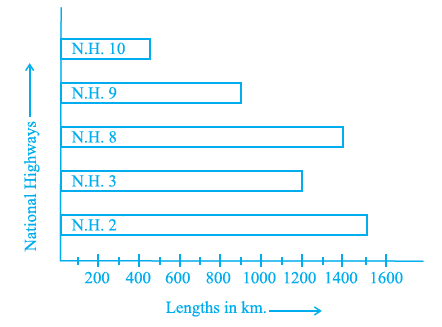
(a) Which National Highway (N.H.) is the longest among the above?
(b) Which National Highway is the shortest among the above?
(c) What is the length of National Highway 9?
(d) Length of which National Highway is about three times the National Highway10?
Answer:
Given:
The horizontal bar graph shows the lengths of various National Highways (N.H.) in India. Based on the scale $1 \text{ unit length} = 200 \text{ km}$, we can determine the lengths as follows:
| National Highway | Length (in km) |
| N.H. 10 | $400$ |
| N.H. 9 | $900$ |
| N.H. 8 | $1,400$ |
| N.H. 3 | $1,200$ |
| N.H. 2 | $1,500$ |
(a) Which National Highway (N.H.) is the longest among the above?
Solution:
By comparing the lengths of the bars in the graph, the bar for N.H. 2 is the longest.
Length of N.H. 2 = $1,500 \text{ km}$
(Maximum length)
Therefore, N.H. 2 is the longest National Highway among the given options.
(b) Which National Highway is the shortest among the above?
Solution:
By comparing the lengths of the bars, the bar for N.H. 10 is the shortest.
Length of N.H. 10 = $400 \text{ km}$
(Minimum length)
Therefore, N.H. 10 is the shortest National Highway among the given options.
(c) What is the length of National Highway 9?
Solution:
Observing the bar graph for N.H. 9, the bar ends exactly halfway between the $800$ and $1000$ marks.
$\text{Length of N.H. 9} = \frac{800 + 1000}{2}$
$\text{Length of N.H. 9} = 900 \text{ km}$
Thus, the length of N.H. 9 is $900 \text{ km}$.
(d) Length of which National Highway is about three times the National Highway 10?
To Find: The National Highway whose length is $3 \times (\text{Length of N.H. 10})$.
Solution:
Length of N.H. 10 = $400 \text{ km}$
Calculated length = $1,200 \text{ km}$.
From our data table, the National Highway with a length of $1,200 \text{ km}$ is N.H. 3.
Therefore, the length of N.H. 3 is three times the length of N.H. 10.
Final Answer:
(a) N.H. 2 is the longest.
(b) N.H. 10 is the shortest.
(c) The length of N.H. 9 is $900 \text{ km}$.
(d) N.H. 3 is three times the length of N.H. 10.
Question 40. The bar graph given below represents the circulation of newspapers in different languages in a town. Study the bar graph and answer the following questions:
Scale : 1 unit length = 200 Newspapers
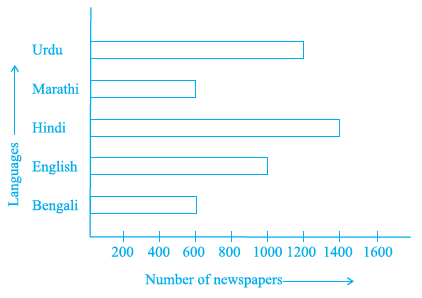
(a) What is the circulation of English newspaper?
(b) Name the two languages in which circulation of newspaper is the same.
(c) By how much is the circulation of newspaper in Hindi more than the newspaper in Bengali?
Answer:
Given:
A horizontal bar graph showing the circulation of newspapers in different languages. According to the scale $1 \text{ unit length} = 200 \text{ Newspapers}$, the data is as follows:
| Language | Number of Newspapers |
| Bengali | $600$ |
| English | $1,000$ |
| Hindi | $1,400$ |
| Marathi | $600$ |
| Urdu | $1,200$ |
(a) What is the circulation of English newspaper?
Solution:
By observing the bar graph, the bar for the English language corresponds to the $1,000$ mark on the horizontal axis.
Therefore, the circulation of English newspaper is $1,000$.
(b) Name the two languages in which circulation of newspaper is the same.
Solution:
From the bar graph, we can see that the lengths of the bars for Bengali and Marathi are equal.
$\text{Bengali} = 600$
(From graph)
$\text{Marathi} = 600$
(From graph)
Thus, the circulation is the same for Bengali and Marathi.
(c) By how much is the circulation of newspaper in Hindi more than the newspaper in Bengali?
To Find: Difference between Hindi and Bengali newspaper circulation.
Solution:
Circulation of Hindi newspaper = $1,400$
Circulation of Bengali newspaper = $600$
To find how much more Hindi newspaper is circulated, we subtract the circulation of Bengali from Hindi:
$\text{Difference} = 1,400 - 600$
$1,400 - 600 = 800$
[Calculated Difference]
Therefore, the circulation of the Hindi newspaper is more than the Bengali newspaper by $800$.
Final Answer:
(a) The circulation of English newspaper is $1,000$.
(b) Bengali and Marathi have the same circulation.
(c) The circulation of Hindi newspaper is $800$ more than the Bengali newspaper.
Question 41. Read the bar graph given below and answer the following questions:
Scale : 1 unit = 50 students
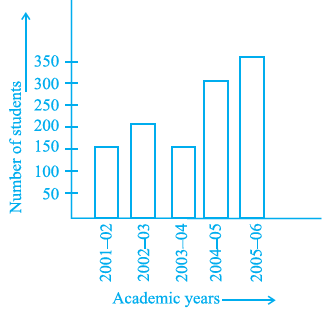
(a) What information is given by the bar graph?
(b) In which year is the number of students maximum?
(c) In which year is the number of students twice as that of 2001-02?
(d) In which year did the number of students decrease as compared to previous year?
(e) In which year is the increase in number of students maximum as compared to the previous year?
Answer:
Given:
A bar graph representing the number of students over several academic years. Based on the scale $1 \text{ unit} = 50 \text{ students}$, the data is as follows:
| Academic Year | Number of Students |
| 2001-02 | $150$ |
| 2002-03 | $200$ |
| 2003-04 | $150$ |
| 2004-05 | $300$ |
| 2005-06 | $350$ |
(a) What information is given by the bar graph?
Solution:
The bar graph provides information about the number of students in a school or institution during different academic years from 2001-02 to 2005-06.
(b) In which year is the number of students maximum?
Solution:
By observing the height of the bars, the bar for the year 2005-06 is the highest.
Maximum number of students = $350$
(In year 2005-06)
Thus, the number of students is maximum in the year 2005-06.
(c) In which year is the number of students twice as that of 2001-02?
Solution:
From the graph, the number of students in 2001-02 is $150$.
Twice the number of students in 2001-02 = $2 \times 150$
Now, observing the graph, the year in which the number of students is $300$ is 2004-05.
Therefore, in the year 2004-05, the number of students is twice as that of 2001-02.
(d) In which year did the number of students decrease as compared to previous year?
Solution:
We look for a year where the bar is shorter than the bar of the immediately preceding year.
Number of students in 2002-03 = $200$
Number of students in 2003-04 = $150$
Since $150 < 200$, there is a decrease in the year 2003-04.
(e) In which year is the increase in number of students maximum as compared to the previous year?
Solution:
We calculate the increase for each year compared to its previous year:
1. Increase in 2002-03 = $200 - 150 = 50$
2. Increase in 2004-05 = $300 - 150 = 150$
3. Increase in 2005-06 = $350 - 300 = 50$
The maximum increase of $150$ students occurred in the year 2004-05.
Final Answer:
(a) The graph shows the number of students in different academic years.
(b) 2005-06.
(c) 2004-05.
(d) 2003-04.
(e) 2004-05.
Question 42. The lengths in km (rounded to nearest hundred) of some major rivers of India is given below:
| River | Length (in km) |
|---|---|
| Narmada | 1300 |
| Mahanadi | 900 |
| Brahmputra | 2900 |
| Ganga | 2500 |
| Kaveri | 800 |
| Krishna | 1300 |
Draw a bar graph to represent the above information.
Answer:
Given: The lengths of major Indian rivers are provided as follows:
| River | Length (in km) |
| Narmada | $1300$ |
| Mahanadi | $900$ |
| Brahmputra | $2900$ |
| Ganga | $2500$ |
| Kaveri | $800$ |
| Krishna | $1300$ |
Construction Required: To represent this data on a bar graph, we choose a suitable scale.
Scale: Let $1$ unit length = $200 \text{ km}$.
Steps to draw the graph:
1. Draw two perpendicular lines, the horizontal axis (x-axis) representing Rivers and the vertical axis (y-axis) representing Length (in km).
2. Along the y-axis, mark points at equal intervals of $200, 400, 600, ...$ up to $3000$.
3. Draw bars of equal width for each river with heights proportional to their lengths.
Question 43. The number of ATMs of different banks in a city is shown below:
| Bank | Number of ATMs |
|---|---|
| Syndicate Bank | 5 |
| Dena Bank | 15 |
| Indian Bank | 20 |
| State Bank of India | 25 |
| Vijya Bank | 10 |
Draw a bar graph to represent the above information by choosing the scale of your choice.
Answer:
Given: The number of ATMs of different banks in a city:
| Bank | Number of ATMs |
| Syndicate Bank | $5$ |
| Dena Bank | $15$ |
| Indian Bank | $20$ |
| State Bank of India | $25$ |
| Vijya Bank | $10$ |
Scale: We choose $1$ unit length = $5 \text{ ATMs}$.
Solution:
Using the chosen scale, the heights of the bars will be:
Syndicate Bank: $5 \div 5 = 1 \text{ unit}$
Dena Bank: $15 \div 5 = 3 \text{ units}$
Indian Bank: $20 \div 5 = 4 \text{ units}$
State Bank of India: $25 \div 5 = 5 \text{ units}$
Vijya Bank: $10 \div 5 = 2 \text{ units}$
Question 44. Number of mobile phone users in various age groups in a city is listed below:
| Age group (in years) | Number of mobile users |
|---|---|
| 1 - 20 | 25000 |
| 21 - 40 | 40000 |
| 41 - 50 | 35000 |
| 61 - 80 | 10000 |
Draw a bar graph to represent the above information.
Answer:
Given: Data of mobile phone users in various age groups:
| Age group (in years) | Number of mobile users |
| $1 - 20$ | $25000$ |
| $21 - 40$ | $40000$ |
| $41 - 50$ | $35000$ |
| $61 - 80$ | $10000$ |
Scale: Let $1$ unit length = $5000 \text{ mobile users}$.
Solution:
The heights of the bars representing the age groups are determined as follows:
For $1 - 20$ years: $\frac{25000}{5000} = 5 \text{ units}$
For $21 - 40$ years: $\frac{40000}{5000} = 8 \text{ units}$
For $41 - 50$ years: $\frac{35000}{5000} = 7 \text{ units}$
For $61 - 80$ years: $\frac{10000}{5000} = 2 \text{ units}$
Question 45. The following table gives the number of vehicles passing through a toll gate, every hour from 8.00 am. to 1.00 pm:
| Time Interval | 8.00 to 9.00 | 9.00 to 10.00 | 10.00 to 11.00 | 11.00 to 12.00 | 12.00 to 1.00 |
|---|---|---|---|---|---|
| Number of vehicles | 250 | 450 | 300 | 250 | 150 |
Draw a bar graph representing the above data.
Answer:
Given: Number of vehicles passing through a toll gate per hour:
| Time Interval | Number of vehicles |
| $8.00 \text{ to } 9.00$ | $250$ |
| $9.00 \text{ to } 10.00$ | $450$ |
| $10.00 \text{ to } 11.00$ | $300$ |
| $11.00 \text{ to } 12.00$ | $250$ |
| $12.00 \text{ to } 1.00$ | $150$ |
Scale: Let $1$ unit length = $50 \text{ vehicles}$.
Solution:
Based on the scale, the bar heights for each time interval are:
$8.00 - 9.00 \text{ am}$: $250 \div 50 = 5 \text{ units}$
$9.00 - 10.00 \text{ am}$: $450 \div 50 = 9 \text{ units}$
$10.00 - 11.00 \text{ am}$: $300 \div 50 = 6 \text{ units}$
$11.00 - 12.00 \text{ am}$: $250 \div 50 = 5 \text{ units}$
$12.00 - 1.00 \text{ pm}$: $150 \div 50 = 3 \text{ units}$
Question 46. The following table represents income of a Gram Panchayat from different sources in a particular year:
| Source | Income |
|---|---|
| Income from local taxes | 75000 |
| Funds received from government | 150000 |
| Donations | 25000 |
| Income from other resources | 50000 |
Draw a bar graph to represent the above information.
Answer:
Given: The income details of a Gram Panchayat are as follows:
| Source of Income | Amount (in $\textsf{₹}$) |
| Local Taxes | $75,000$ |
| Government Funds | $1,50,000$ |
| Donations | $25,000$ |
| Other Resources | $50,000$ |
Construction: We choose a scale to represent these large values on a bar graph.
Scale: Let $1$ unit length = $\textsf{₹} 25,000$.
Based on this scale, the lengths of the bars will be:
1. Local Taxes: $\frac{75000}{25000} = 3 \text{ units}$
2. Government Funds: $\frac{150000}{25000} = 6 \text{ units}$
3. Donations: $\frac{25000}{25000} = 1 \text{ unit}$
4. Other Resources: $\frac{50000}{25000} = 2 \text{ units}$
Question 47. The following table gives the data of number of schools (stage-wise) of a country in the year 2002.
| Stage | Number of schools (in thousands) |
|---|---|
| Primary | 80 |
| Upper Primary | 55 |
| Secondary | 30 |
| Higher Secondary | 20 |
Draw a bar graph to represent the above data:
Answer:
Given: Number of schools stage-wise in the year 2002:
| Stage | Number of Schools (in thousands) |
| Primary | $80$ |
| Upper Primary | $55$ |
| Secondary | $30$ |
| Higher Secondary | $20$ |
Scale: Let $1$ unit length = $10 \text{ thousand schools}$.
Solution:
Using the scale, we draw bars for each stage:
Primary: $8 \text{ units}$
Upper Primary: $5.5 \text{ units}$
Secondary: $3 \text{ units}$
Higher Secondary: $2 \text{ units}$
Question 48. Home appliances sold by a shop in one month are given as below:
| Home appliance | Number of home appliances |
|---|---|
| Refrigerator | 75 |
| Television | 45 |
| Washing Machine | 30 |
| Cooler | 60 |
| DVD Player | 30 |
Draw a bar graph to represent the above information.
Answer:
Given: Data for home appliances sold in a month:
| Home Appliance | Number of Units Sold |
| Refrigerator | $75$ |
| Television | $45$ |
| Washing Machine | $30$ |
| Cooler | $60$ |
| DVD Player | $30$ |
Scale: Let $1$ unit length = $15 \text{ appliances}$.
Construction: Draw bars of equal width on the horizontal axis and number of appliances on the vertical axis.
Refrigerator bar height: $75 \div 15 = 5 \text{ units}$
Television bar height: $45 \div 15 = 3 \text{ units}$
Washing Machine bar height: $30 \div 15 = 2 \text{ units}$
Cooler bar height: $60 \div 15 = 4 \text{ units}$
DVD Player bar height: $30 \div 15 = 2 \text{ units}$
Question 49. In a botanical garden, the number of different types of plants are found as follows:
| Type of the plant | Number of plants |
|---|---|
| Herb | 50 |
| Shrub | 60 |
| Creeper | 20 |
| Climber | 45 |
| Tree | 95 |
Draw a bar graph to represent the above information and answer the following questions:
(a) Which type of plant is maximum in number in the garden?
(b) Which type of plant is minimum in number in the garden?
Answer:
Given: The distribution of plants in a botanical garden:
| Type of Plant | Number of Plants |
| Herb | $50$ |
| Shrub | $60$ |
| Creeper | $20$ |
| Climber | $45$ |
| Tree | $95$ |
Scale: Let $1$ unit length = $10 \text{ plants}$.
Bar Graph Construction: Draw the vertical axis representing the number of plants and horizontal axis representing types. The heights will be $5, 6, 2, 4.5,$ and $9.5$ units respectively.
Answers to sub-questions:
(a) By observing the heights of the bars, the bar for Tree is the highest ($95$). Therefore, the Tree type of plant is maximum in number.
(b) By observing the heights of the bars, the bar for Creeper is the shortest ($20$). Therefore, the Creeper type of plant is minimum in number.
Final Answer:
The bar graphs for all questions have been constructed as per the chosen scales. For Q49, (a) Tree is maximum and (b) Creeper is minimum.
Question 50. Prepare a bar graph of the data given in question 28.
Answer:
Given:
The following data represents the number of people associated with different surnames, as derived from the pictograph in Question 28 (where $1$ symbol = $100$ people and each finger in a partial symbol represents $20$ people):
| Surname | Number of People |
| Khan | $360$ |
| Patel | $500$ |
| Rao | $400$ |
| Roy | $400$ |
| Saikia | $200$ |
| Singh | $300$ |
To Represent: A bar graph for the given data.
Construction Required:
To draw the bar graph, we follow these steps:
1. Draw two perpendicular lines: a horizontal axis (x-axis) to represent the Surnames and a vertical axis (y-axis) to represent the Number of People.
2. Scale Selection: Let $1$ unit length = $100$ people.
3. Along the vertical axis, mark points at equal intervals: $100, 200, 300, 400, 500$.
4. Along the horizontal axis, draw bars of uniform width for each surname with heights proportional to the number of people.
Solution:
Based on the scale $1 \text{ unit} = 100 \text{ people}$, the heights of the bars are calculated as follows:
$\text{Height of Khan's bar} = \frac{360}{100} = 3.6 \text{ units}$
$\text{Height of Patel's bar} = \frac{500}{100} = 5 \text{ units}$
$\text{Height of Rao's bar} = \frac{400}{100} = 4 \text{ units}$
$\text{Height of Roy's bar} = \frac{400}{100} = 4 \text{ units}$
$\text{Height of Saikia's bar} = \frac{200}{100} = 2 \text{ units}$
$\text{Height of Singh's bar} = \frac{300}{100} = 3 \text{ units}$
Final Answer: The above bar graph accurately represents the distribution of people among the various surnames using the scale $1$ unit length = $100$ people.
Question 51. Refer to question 39. Prepare a pictograph of the data by taking a suitable symbol to represent 200 kilometers.
Answer:
Given:
The lengths of various National Highways (N.H.) in India as determined from Question 39 are:
| National Highway | Length (in km) |
| N.H. 10 | $400$ |
| N.H. 9 | $900$ |
| N.H. 8 | $1,400$ |
| N.H. 3 | $1,200$ |
| N.H. 2 | $1,500$ |
To Prepare: A pictograph using a suitable symbol.
Scale: Let one symbol 🛣️ represent $200 \text{ km}$.
Calculation for symbols:
1. N.H. 10: $\frac{400}{200} = 2$ symbols
2. N.H. 9: $\frac{900}{200} = 4.5$ symbols ($4$ full + $1$ half)
3. N.H. 8: $\frac{1400}{200} = 7$ symbols
4. N.H. 3: $\frac{1200}{200} = 6$ symbols
5. N.H. 2: $\frac{1500}{200} = 7.5$ symbols ($7$ full + $1$ half)
Pictograph:
(Scale: 🛣️ = $200 \text{ km}$)
| N.H. 10: | 🛣️ 🛣️ |
| N.H. 9: | 🛣️ 🛣️ 🛣️ 🛣️ 🛣️ |
| N.H. 8: | 🛣️ 🛣️ 🛣️ 🛣️ 🛣️ 🛣️ 🛣️ |
| N.H. 3: | 🛣️ 🛣️ 🛣️ 🛣️ 🛣️ 🛣️ |
| N.H. 2: | 🛣️ 🛣️ 🛣️ 🛣️ 🛣️ 🛣️ 🛣️ 🛣️ |
Final Answer: The pictograph above represents the lengths of the specified National Highways where one symbol (🛣️) equals $200 \text{ km}$.
Question 52. Prepare a pictograph of the information given in question 38.
Answer:
Given:
The following data represents the number of railway tickets sold for different cities based on Question 38:
| City | Number of Tickets Sold |
| Patna | $80$ |
| Jaipur | $50$ |
| Delhi | $105$ |
| Chennai | $20$ |
| Guwahati | $40$ |
To Prepare: A pictograph representing the above data.
Scale: Let one symbol 🎫 represent $10$ tickets.
Calculation for symbols:
We divide the number of tickets for each city by the scale value ($10$):
1. Patna: $\frac{80}{10} = 8$ symbols
2. Jaipur: $\frac{50}{10} = 5$ symbols
3. Delhi: $\frac{105}{10} = 10.5$ symbols ($10$ full symbols + $1$ half symbol)
4. Chennai: $\frac{20}{10} = 2$ symbols
5. Guwahati: $\frac{40}{10} = 4$ symbols
Pictograph:
(Scale: 🎫 = $10$ tickets)
| Patna: | 🎫 🎫 🎫 🎫 🎫 🎫 🎫 🎫 |
| Jaipur: | 🎫 🎫 🎫 🎫 🎫 |
| Delhi: | 🎫 🎫 🎫 🎫 🎫 🎫 🎫 🎫 🎫 🎫 🎫 |
| Chennai: | 🎫 🎫 |
| Guwahati: | 🎫 🎫 🎫 🎫 |
Final Answer: The pictograph above illustrates the ticket sales for various cities, using the scale of $1$ symbol (🎫) = $10$ tickets.
Question 53. Refer to question 23. Prepare a bar graph of the data.
Answer:
Given:
The number of two-wheelers owned by $50$ families is provided. First, we organize this data into a frequency distribution table using tally marks.
| Number of Two Wheelers | Tally Marks | Number of Families (Frequency) |
| 0 | $|||$ | $3$ |
| 1 | $\bcancel{||||}$ $\bcancel{||||}$ $\bcancel{||||}$ $\bcancel{||||}$ $\bcancel{||||}$ $|||$ | $28$ |
| 2 | $\bcancel{||||}$ $\bcancel{||||}$ $||||$ | $14$ |
| 3 | $||||$ | $4$ |
| 4 | $|$ | $1$ |
| Total | 50 |
Construction Required:
To prepare the bar graph, we use the following specifications:
1. Horizontal Axis (x-axis): Represents the 'Number of Two Wheelers' $(0, 1, 2, 3, 4)$.
2. Vertical Axis (y-axis): Represents the 'Number of Families'.
3. Scale: Let $1$ unit length = $5$ families.
Steps:
We draw bars of equal width. The height of the bar for $1$ two-wheeler will be the highest ($28$ families), while the bar for $4$ two-wheelers will be the shortest ($1$ family).
Question 54. The following table shows the area of the land on which different crops were grown.
| Crop | Area of land (in million hectrares) |
|---|---|
| Rice | 50 |
| Wheat | 30 |
| Pulses | 20 |
| Sugarcane | 25 |
| Cotton | 15 |
Prepare a pictograph by choosing a suitable symbol to represent 10 million hectares.
Answer:
Given:
The area of land (in million hectares) for various crops is as follows:
| Crop | Area of Land (in million hectares) |
| Rice | $50$ |
| Wheat | $30$ |
| Pulses | $20$ |
| Sugarcane | $25$ |
| Cotton | $15$ |
Scale: Let one symbol 🌾 represent $10$ million hectares.
Calculation for symbols:
To find the number of symbols for each crop, we divide the area by the scale ($10$):
1. Rice: $50 \div 10 = 5$ symbols
2. Wheat: $30 \div 10 = 3$ symbols
3. Pulses: $20 \div 10 = 2$ symbols
4. Sugarcane: $25 \div 10 = 2.5$ symbols ($2$ full + $1$ half symbol)
5. Cotton: $15 \div 10 = 1.5$ symbols ($1$ full + $1$ half symbol)
Pictograph:
(Scale: 🌾 = $10$ million hectares)
| Rice: | 🌾 🌾 🌾 🌾 🌾 |
| Wheat: | 🌾 🌾 🌾 |
| Pulses: | 🌾 🌾 |
| Sugarcane: | 🌾 🌾 🌾 |
| Cotton: | 🌾 🌾 |
Question 55. Refer to question 54. Prepare a bar graph of the data.
Answer:
Given:
The area of land (in million hectares) for various crops is as follows:
| Crop | Area of Land (in million hectares) |
| Rice | $50$ |
| Wheat | $30$ |
| Pulses | $20$ |
| Sugarcane | $25$ |
| Cotton | $15$ |
Construction Required:
To represent the land area data on a bar graph, we follow these steps:
1. Draw the horizontal axis (x-axis) for Crops and the vertical axis (y-axis) for Area of land (in million hectares).
2. Scale Selection: Let $1$ unit length = $5$ million hectares.
3. Along the vertical axis, mark values at equal intervals: $5, 10, 15, 20, 25, 30, 35, 40, 45, 50$.
4. Draw bars of uniform width for each crop with heights corresponding to their area values.
Height of bars based on scale:
Rice = $10$ units
Wheat = $6$ units
Pulses = $4$ units
Sugarcane = $5$ units
Cotton = $3$ units