

Chapter 3 Data Handling (Class 7 - Maths NCERT Exemplar Solutions)
Welcome to the detailed resource for NCERT Exemplar Solutions for Class 7 Mathematics: Chapter 3 Data Handling! This chapter is strategically designed to push students beyond basic data representation, focusing on deepening analytical skills and fostering a robust understanding of statistical measures. These solutions guide learners through the critical interpretation of datasets, helping them understand how to extract meaningful information from complex information sets and prepare for higher-level statistical analysis.
The solutions meticulously cover the foundational processes of collecting and organizing data. Students will master the construction of frequency distribution tables using tally marks, where a count of four is recorded as $||||$ and a count of five is bundled as $\bcancel{||||}$. A major focus of this chapter is calculating the three primary measures of central tendency: the Mean, calculated as $\text{Mean} = \frac{\text{Sum of all observations}}{\text{Number of observations}}$; the Median, which is the middle value of an ordered dataset; and the Mode, the most frequently occurring value. Understanding which measure is the most appropriate representative value for a given context is a key learning objective.
Graphical literacy is further enhanced through the interpretation and construction of double bar graphs, which are essential for comparing two related datasets side-by-side. Additionally, the chapter introduces the fundamental principles of Probability. Students will learn to identify outcomes and calculate the probability of an event using the formula: $P(\text{Event}) = \frac{\text{Number of Favorable Outcomes}}{\text{Total Number of Possible Outcomes}}$. With clear step-by-step calculations and logical reasoning prepared by learningspot.co, students can build the confidence needed to excel in data analysis and probabilistic reasoning.
| Content On This Page | ||
|---|---|---|
| Solved Examples (Examples 1 to 17) | Question 1 to 16 (Multiple Choice Questions) | Question 17 to 31 (Fill in the Blanks) |
| Question 32 to 49 (True or False) | Question 50 to 91 | |
Solved Examples (Examples 1 to 17)
In Examples 1 to 3, there are four options, out of which only one is correct. Write the correct answer.
Example 1: The range of the data 14, 6, 12, 17, 21, 10, 4, 3 is
(a) 21
(b) 17
(c) 18
(d) 11
Answer:
Given:
Data set: $14, 6, 12, 17, 21, 10, 4, 3$
Solution:
The range of a data set is the difference between the highest observation and the lowest observation.
$\text{Highest observation} = 21$
$\text{Lowest observation} = 3$
$\text{Range} = 21 - 3$
$\text{Range} = 18$
Thus, the correct option is (c).
Example 2: The mode of the data 23, 26, 22, 29, 23, 29, 26, 29, 22, 23 is
(a) 23 and 29
(b) 23 only
(c) 29 only
(d) 26 only
Answer:
Given:
Data set: $23, 26, 22, 29, 23, 29, 26, 29, 22, 23$
Solution:
Mode is the observation that occurs most frequently in the data.
Let's count the frequency of each observation:
• $22$ appears $2$ times.
• $23$ appears $3$ times.
• $26$ appears $2$ times.
• $29$ appears $3$ times.
Since both $23$ and $29$ occur with the maximum frequency of $3$, they are both the modes of the data.
Thus, the correct option is (a).
Example 3: The median of the data 40, 50, 99, 68, 98, 60, 94 is
(a) 40
(b) 60
(c) 68
(d) 99
Answer:
Given:
Data set: $40, 50, 99, 68, 98, 60, 94$
Solution:
To find the median, we first arrange the data in ascending order:
$40, 50, 60, 68, 94, 98, 99$
Here, the number of observations ($n$) is $7$, which is odd.
The median is the $\left( \frac{n + 1}{2} \right)^{th}$ observation.
$\text{Median} = \left( \frac{7 + 1}{2} \right)^{th} \text{ observation} = 4^{th} \text{ observation}$
The $4^{th}$ term in the sorted list is $68$.
Thus, the correct option is (c).
In Examples 4 and 5, fill in the blanks to make the statements true.
Example 4: The mean of first five prime numbers is __________.
Answer:
Given:
We need to find the mean of the first five prime numbers.
Solution:
The first five prime numbers are: $2, 3, 5, 7, 11$
$\text{Mean} = \frac{\text{Sum of all observations}}{\text{Total number of observations}}$
$\text{Sum} = 2 + 3 + 5 + 7 + 11 = 28$
$\text{Mean} = \frac{28}{5}$
$\text{Mean} = 5.6$
The mean of first five prime numbers is $5.6$.
Example 5: The probability of getting a number greater than 2 on throwing a die once is _________.
Answer:
Given:
A die is thrown once.
Solution:
Total possible outcomes on a die are $\{1, 2, 3, 4, 5, 6\}$.
$\text{Number of total outcomes} = 6$
Favourable outcomes (numbers greater than $2$) are $\{3, 4, 5, 6\}$.
$\text{Number of favourable outcomes} = 4$
$\text{Probability} = \frac{\text{Number of favourable outcomes}}{\text{Total number of outcomes}}$
$\text{Probability} = \frac{\cancel{4}^2}{\cancel{6}_3} = \frac{2}{3}$
The probability of getting a number greater than $2$ is $\frac{2}{3}$.
In Examples 6, 7 and 8, state whether the statements are True or False .
Example 6: The mode of the observations 23, 26, 15, 12, 28, 38, 19, 23, 26, 23 is 28.
Answer:
Solution:
Let's check the frequency of observations:
• $23$ appears $3$ times.
• $26$ appears $2$ times.
• $12, 15, 19, 28, 38$ each appear only $1$ time.
Since $23$ occurs most often, the mode is $23$.
The statement says the mode is $28$, which is incorrect.
Therefore, the statement is False.
Example 7:
| Size of Sweater | Number of sweaters Sold |
|---|---|
| 40 | 15 |
| 42 | 17 |
| 44 | 13 |
| 46 | 14 |
| 48 | 11 |
| Total | 70 |
In the above table
(a) The most popular size is 17.
(b) 17 is the median for above data.
Answer:
Solution (a):
The "most popular" size refers to the Mode. In the table, the maximum number of sweaters sold is $17$, which corresponds to Size 42.
Thus, the most popular size is $42$, not $17$ ($17$ is the frequency).
Therefore, statement (a) is False.
Solution (b):
The total number of observations ($N$) is $70$. The median would be the size corresponding to the middle terms ($\approx 35^{th}$ term).
The cumulative frequencies are: $15, 32, 45, 59, 70$.
The $35^{th}$ observation falls in the category of Size 44. $17$ is not a size, it is a frequency of a different size.
Therefore, statement (b) is False.
Example 8: Median of the data:
4, 5, 9, 2, 6, 8, 7 is 2
Answer:
Solution:
First, arrange the data in ascending order:
$2, 4, 5, 6, 7, 8, 9$
The number of observations is $7$. The median is the middle observation.
The middle ($4^{th}$) observation is $6$.
The statement says the median is $2$, which is incorrect ($2$ is the minimum value).
Therefore, the statement is False.
Example 9: Find the median of the data:
| 3 | 11 | 7 | 2 | 5 | 9 | 9 | 2 | 10 | 15 |
| 7 |
Answer:
Given:
The observations are: $3, 11, 7, 2, 5, 9, 9, 2, 10, 15, 7$
To Find:
The median of the given data.
Solution:
To find the median, we first arrange the data in ascending order:
$2, 2, 3, 5, 7, 7, 9, 9, 10, 11, 15$
The number of observations ($n$) is $11$, which is an odd number.
The formula for the median when $n$ is odd is:
$\text{Median} = \left( \frac{n + 1}{2} \right)^{th} \text{ observation}$
Substituting $n = 11$:
$\text{Median} = \left( \frac{11 + 1}{2} \right)^{th} \text{ observation}$
$\text{Median} = \left( \frac{12}{2} \right)^{th} \text{ observation} = 6^{th} \text{ observation}$
The $6^{th}$ observation in the sorted data is $7$.
Therefore, the median of the data is $7$.
Example 10: Find the median of the data :
| 21 | 15 | 6 | 25 | 18 | 13 | 20 | 9 | 8 | 12 |
Answer:
Given:
The observations are: $21, 15, 6, 25, 18, 13, 20, 9, 8, 12$
To Find:
The median of the given data.
Solution:
First, we arrange the data in ascending order:
$6, 8, 9, 12, 13, 15, 18, 20, 21, 25$
The number of observations ($n$) is $10$, which is an even number.
When $n$ is even, the median is the average of the two middle terms, i.e., the $\left( \frac{n}{2} \right)^{th}$ and $\left( \frac{n}{2} + 1 \right)^{th}$ observations.
$\frac{n}{2} = \frac{10}{2} = 5^{th} \text{ observation}$
$\frac{n}{2} + 1 = 6^{th} \text{ observation}$
In the sorted list, the $5^{th}$ observation is $13$ and the $6^{th}$ observation is $15$.
$\text{Median} = \frac{13 + 15}{2}$
$\text{Median} = \frac{28}{2} = 14$
Therefore, the median of the data is $14$.
Example 11: The cards bearing letters of the word “MATHEMATICS” are placed in a bag. A card is taken out from the bag without looking into the bag (at random).
(a) How many outcomes are possible when a letter is taken out of the bag at random?
(b) What is the probability of getting
(i) M?
(ii) Any vowel?
(iii) Any consonant?
(iv) X?
Answer:
Given:
The word is "MATHEMATICS".
Letters: $M, A, T, H, E, M, A, T, I, C, S$
Solution (a):
The total number of possible outcomes is the total number of letters in the word "MATHEMATICS".
Counting the letters, we get $11$ letters.
Thus, there are $11$ possible outcomes.
Solution (b):
The probability $P(E)$ of an event $E$ occurring is given by:
$P(E) = \frac{\text{Number of favourable outcomes}}{\text{Total number of outcomes}}$
(i) Probability of getting 'M':
Number of 'M's in the word = $2$ ($M, M$)
$P(M) = \frac{2}{11}$
(ii) Probability of getting any vowel:
Vowels in the word are: $A, E, A, I$
Number of favourable outcomes = $4$
$P(\text{Vowel}) = \frac{4}{11}$
(iii) Probability of getting any consonant:
Consonants in the word are: $M, T, H, M, T, C, S$
Number of favourable outcomes = $7$
$P(\text{Consonant}) = \frac{7}{11}$
(iv) Probability of getting 'X':
There is no letter 'X' in the word "MATHEMATICS".
Number of favourable outcomes = $0$
$P(X) = \frac{0}{11} = 0$
Example 12: If the mean of 26, 28, 25, x, 24 is 27, find the value of x.
Answer:
Given:
Observations: $26, 28, 25, x, 24$
Mean = $27$
Number of observations ($n$) = $5$
Solution:
The formula for the mean is:
$\text{Mean} = \frac{\text{Sum of all observations}}{n}$
Substituting the given values:
$27 = \frac{26 + 28 + 25 + x + 24}{5}$
Multiply both sides by $5$:
$27 \times 5 = 26 + 28 + 25 + 24 + x$
$135 = 103 + x$
To find $x$, subtract $103$ from $135$:
$x = 135 - 103$
The value of $x$ is $32$.
Example 13: The mean of 10 observations was calculated as 40. It was detected on rechecking that the value of 45 was wrongly copied as 15. Find the correct mean.
Answer:
Given:
Number of observations ($n$) = $10$
Incorrect mean = $40$
Incorrect value copied = $15$
Correct value to be used = $45$
Solution:
First, we find the Incorrect sum of the observations:
$\text{Incorrect Sum} = \text{Mean} \times n$
$\text{Incorrect Sum} = 40 \times 10 = 400$
Now, we find the Correct sum by subtracting the incorrect value and adding the correct one:
$\text{Correct Sum} = \text{Incorrect Sum} - \text{Incorrect Value} + \text{Correct Value}$
$\text{Correct Sum} = 400 - 15 + 45$
$\text{Correct Sum} = 400 + 30 = 430$
Finally, we calculate the Correct mean:
$\text{Correct Mean} = \frac{\text{Correct Sum}}{n}$
$\text{Correct Mean} = \frac{430}{10}$
$\text{Correct Mean} = 43$
The correct mean is $43$.
Example 14: The median of observations 11, 12, 14, 18, x + 2, 20, 22, 25, 61 arranged in ascending order is 21. Find the value of x.
Answer:
Given:
Observations in ascending order: $11, 12, 14, 18, x + 2, 20, 22, 25, 61$
Median = $21$
To Find:
The value of $x$.
Solution:
Count the number of observations ($n$):
$n = 9$
Since the number of observations is odd, the median is the $\left( \frac{n + 1}{2} \right)^{th}$ term.
$\text{Median} = \left( \frac{9 + 1}{2} \right)^{th} \text{ observation}$
$\text{Median} = 5^{th} \text{ observation}$
From the given data, the $5^{th}$ observation is $x + 2$.
$x + 2 = 21$
(Given Median)
$x = 21 - 2$
$x = 19$
Example 15: Study the double bar graph given below and answer the questions that follow:
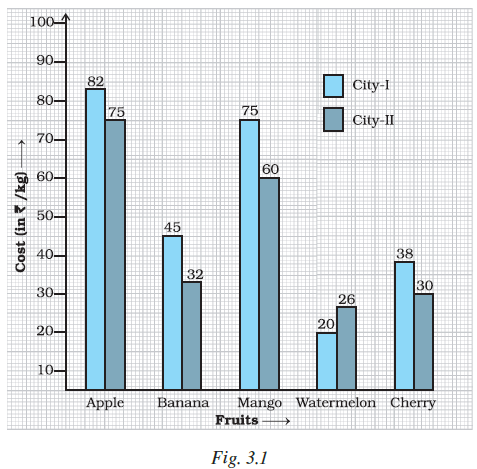
(a) What information does the above double graph depict?
(b) Name the fruits for which cost of 1 kg is greater in City I as compared to City II.
(c) What is the difference of rates for apples in both the cities?
(d) Find the ratio of the cost of mangoes per kg in City I to the cost of mangoes per kg in City II.
Answer:
Solution:
(a) The double bar graph depicts the comparison of the cost (in $\textsf{₹}/\text{kg}$) of five different fruits (Apple, Banana, Mango, Watermelon, and Cherry) in two different cities, City I and City II.
(b) By comparing the heights of the bars for each fruit:
1. Apple: City I ($\textsf{₹} 82$) $>$ City II ($\textsf{₹} 75$)
2. Banana: City I ($\textsf{₹} 45$) $>$ City II ($\textsf{₹} 32$)
3. Mango: City I ($\textsf{₹} 75$) $>$ City II ($\textsf{₹} 60$)
4. Cherry: City I ($\textsf{₹} 38$) $>$ City II ($\textsf{₹} 30$)
The fruits for which the cost is greater in City I are Apple, Banana, Mango, and Cherry.
(c) Rate of apples in City I = $\textsf{₹} 82/\text{kg}$
Rate of apples in City II = $\textsf{₹} 75/\text{kg}$
$\text{Difference} = \textsf{₹} 82 - \textsf{₹} 75$
$\text{Difference} = \textsf{₹} 7$
The difference in rates for apples is $\textsf{₹} 7$.
(d) Cost of mangoes in City I = $\textsf{₹} 75$
Cost of mangoes in City II = $\textsf{₹} 60$
$\text{Ratio} = \frac{75}{60}$
Simplifying the fraction by dividing both by $15$:
$\text{Ratio} = \frac{\cancel{75}^5}{\cancel{60}_4} = \frac{5}{4}$
The required ratio is $5 : 4$.
Example 16: The following double bar graph represents test matches results summary for Cricket Team of country X against different countries:
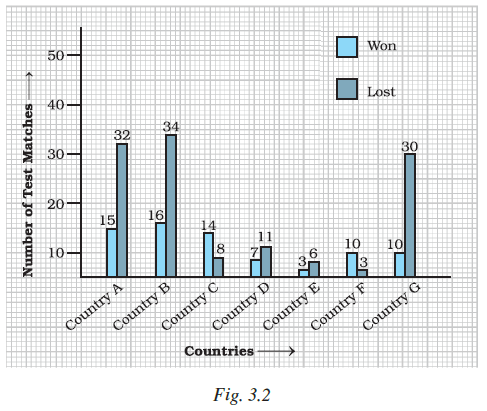
Use the bar graph to answer the following questions:
(a) Which country has managed maximum wins against country X?
(b) The difference between the number of matches won and lost is highest for which country against country X?
(c) Number of wins of country E is the same as number of losses of which country against country X?
Answer:
Solution:
Note: In this graph, "Won" (Light Blue) represents matches won by Country X, and "Lost" (Dark Blue) represents matches lost by Country X (which means wins for the opposing country).
(a) Maximum wins against Country X corresponds to the tallest "Lost" bar for Country X.
For Country B, the number of matches lost by X is $34$, which is the highest in the graph.
Thus, Country B has managed maximum wins against Country X.
(b) Let's calculate the absolute difference between matches won and lost for each country:
• Country A: $|15 - 32| = 17$
• Country B: $|16 - 34| = 18$
• Country C: $|14 - 8| = 6$
• Country D: $|7 - 11| = 4$
• Country E: $|3 - 6| = 3$
• Country F: $|10 - 3| = 7$
• Country G: $|10 - 30| = 20$
The difference is highest for Country G.
(c) From the graph:
Wins of Country X against Country E = $3$ (Light blue bar for E)
Losses of Country X against Country F = $3$ (Dark blue bar for F)
Therefore, the number of wins of Country X against Country E is the same as the number of losses of Country X against Country F.
Example 17: The double bar graph given below compares the class-averages in half yearly and annual examinations of 5 sections of Class VII.
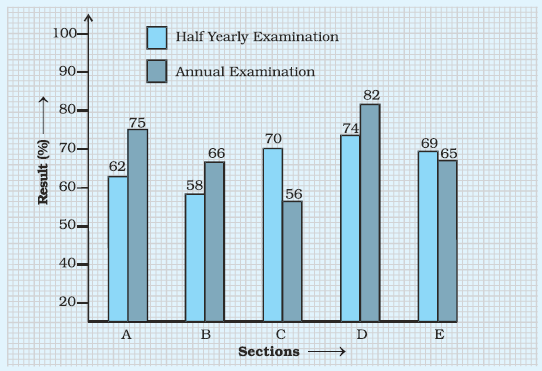
Observe the graph carefully and tell which section showed the most improvement and by how much?
Answer:
To Find:
The section with the most improvement (Annual Result $-$ Half Yearly Result).
Solution:
Let's calculate the improvement for each section:
• Section A: $75\% - 62\% = 13\%$
• Section B: $66\% - 58\% = 8\%$
• Section C: $56\% - 70\% = -14\%$ (Result declined)
• Section D: $82\% - 74\% = 8\%$
• Section E: $65\% - 69\% = -4\%$ (Result declined)
By comparing the values, we can see that $13\%$ is the highest positive difference.
Thus, Section A showed the most improvement by $13\%$.
Exercise
Question 1 to 16 (Multiple Choice Questions)
In Questions 1 to 16, there are four options, out of which only one is correct. Write the correct answer.
Question 1. Let x, y, z be three observations. The mean of these observations is
(a) $\frac{x × y × z}{3}$
(b) $\frac{x + y + z}{3}$
(c) $\frac{x − y − z}{3}$
(d) $\frac{x × y + z}{3}$
Answer:
Solution:
The arithmetic mean of a set of data is defined as the sum of all observations divided by the total number of observations.
$\text{Mean} = \frac{\text{Sum of observations}}{\text{Number of observations}}$
For the given observations $x, y,$ and $z$:
$\text{Mean} = \frac{x + y + z}{3}$
Thus, the correct option is (b).
Question 2. The number of trees in different parks of a city are 33, 38, 48, 33, 34, 34, 33 and 24. The mode of this data is
(a) 24
(b) 34
(c) 33
(d) 48
Answer:
Given:
Data set: $33, 38, 48, 33, 34, 34, 33, 24$
Solution:
The mode is the observation that occurs most frequently in a data set.
Let's find the frequency of each observation:
• $24$ appears $1$ time.
• $33$ appears $3$ times.
• $34$ appears $2$ times.
• $38$ appears $1$ time.
• $48$ appears $1$ time.
Since $33$ has the highest frequency ($3$ times), it is the mode of the data.
Thus, the correct option is (c).
Question 3. Which measures of central tendency get affected if the extreme observations on both the ends of a data arranged in descending order are removed?
(a) Mean and mode
(b) Mean and Median
(c) Mode and Median
(d) Mean, Median and Mode
Answer:
Solution:
1. Mean: The mean depends on the sum of all observations. If the largest and smallest (extreme) observations are removed, the sum changes significantly, thus the mean is always affected.
2. Median: The median is the middle-most value. Removing one observation from each end of an ordered list does not change the middle position (unless the data set is extremely small), so the median is generally not affected.
3. Mode: If one of the extreme observations removed happened to be the most frequent value (the mode), then the mode will be affected.
In most statistical contexts, the measures most sensitive to outliers or extreme values are the mean and potentially the mode.
Thus, the correct option is (a).
Question 4. The range of the data : 21, 6, 17, 18, 12, 8, 4, 13 is
(a) 17
(b) 12
(c) 8
(d) 15
Answer:
Given:
Data set: $21, 6, 17, 18, 12, 8, 4, 13$
Solution:
Range is the difference between the highest and the lowest observations in the data.
$\text{Highest observation} = 21$
$\text{Lowest observation} = 4$
$\text{Range} = 21 - 4$
$\text{Range} = 17$
Thus, the correct option is (a).
Question 5. The median of the data : 3, 4, 5, 6, 7, 3, 4 is
(a) 5
(b) 3
(c) 4
(d) 6
Answer:
Given:
Data set: $3, 4, 5, 6, 7, 3, 4$
Solution:
To find the median, first arrange the data in ascending order:
$3, 3, 4, 4, 5, 6, 7$
The number of observations ($n$) is $7$, which is odd.
$\text{Median} = \left( \frac{n + 1}{2} \right)^{th} \text{ observation}$
$\text{Median} = \left( \frac{7 + 1}{2} \right)^{th} \text{ observation} = 4^{th} \text{ observation}$
The $4^{th}$ observation in the sorted data is $4$.
Thus, the correct option is (c).
Question 6. Out of 5 brands of chocolates in a shop, a boy has to purchase the brand which is most liked by children. What measure of central tendency would be most appropriate if the data is provided to him?
(a) Mean
(b) Mode
(c) Median
(d) Any of the three
Answer:
Solution:
In market research, to find the "most liked" or "most popular" item, we look for the item that appears with the highest frequency in the survey data.
The measure of central tendency that identifies the most frequent value is the Mode.
Thus, the correct option is (b).
Question 7. There are 2 aces in each of the given set of cards placed face down. From which set are you certain to pick the two aces in the first go?

Answer:
Given:
Each set contains $2$ aces. We want to be "certain" to pick both aces in the first attempt.
Solution:
An event is certain only when the probability of occurrence is $1$. For us to be certain to pick $2$ aces by picking $2$ cards, the total number of cards in that set must be exactly $2$.
Analyzing the images:
• Set (a) contains $4$ cards.
• Set (b) contains $5$ cards.
• Set (c) contains $2$ cards.
• Set (d) contains $6$ cards.
In set (c), since there are only $2$ cards and both are aces, picking $2$ cards will guarantee picking both aces.
Thus, the correct option is (c).
Question 8. In the previous question, what is the probability of picking up an ace from set (d)?
(a) $\frac{1}{6}$
(b) $\frac{2}{6}$
(c) $\frac{3}{6}$
(d) $\frac{4}{6}$
Answer:
Given:
Total number of cards in set (d) = $6$
Number of aces in each set = $2$
Solution:
The probability of an event is given by:
$P(E) = \frac{\text{Number of favourable outcomes}}{\text{Total number of outcomes}}$
For set (d):
$\text{Favourable outcomes (Aces)} = 2$
$\text{Total outcomes (Cards)} = 6$
$P(\text{Picking an Ace}) = \frac{2}{6}$
Thus, the correct option is (b).
Question 9. The difference between the highest and the lowest observations in a data is its
(a) frequency
(b) width
(c) range
(d) mode
Answer:
Solution:
In statistics, the difference between the maximum (highest) value and the minimum (lowest) value in a data set is defined as the range.
$\text{Range} = \text{Highest observation} - \text{Lowest observation}$
Thus, the correct option is (c).
Question 10. In a school, only 2 out of 5 students can participate in a quiz. What is the chance that a student picked at random makes it to the competition?
(a) 20%
(b) 40%
(c) 50%
(d) 30%
Answer:
Given:
Number of students who can participate = $2$
Total number of students = $5$
Solution:
The probability or "chance" of a student being picked is:
$\text{Probability} = \frac{\text{Favourable outcomes}}{\text{Total outcomes}}$
$\text{Probability} = \frac{2}{5}$
To convert this chance into a percentage, we multiply by $100$:
$\text{Percentage chance} = \frac{2}{5} \times 100\%$
$\text{Percentage chance} = 2 \times 20\% = 40\%$
Thus, the correct option is (b).
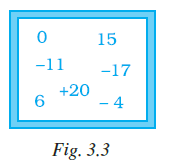
Question 11. Some integers are marked on a board. What is the range of these integers?
(a) 31
(b) 37
(c) 20
(d) 3
Answer:
Given:
The integers shown on the board (Fig. 3.3) are: $0, 15, -11, -17, +20, 6, -4$
Solution:
To find the range, we identify the highest and lowest integers:
$\text{Highest integer} = +20$
$\text{Lowest integer} = -17$
The range is the difference between these two values:
$\text{Range} = 20 - (-17)$
$\text{Range} = 20 + 17 = 37$
Thus, the correct option is (b).
Question 12. On tossing a coin, the outcome is
(a) only head
(b) only tail
(c) neither head nor tail
(d) either head or tail
Answer:
Solution:
A fair coin has two distinct faces: a Head and a Tail.
When a coin is tossed, it is a random experiment where the result will be one of these two possibilities. Therefore, the outcome is either head or tail.
Thus, the correct option is (d).
Question 13. The mean of three numbers is 40. All the three numbers are different natural numbers. If lowest is 19, what could be highest possible number of remaining two numbers?
(a) 81
(b) 40
(c) 100
(d) 71
Answer:
Given:
Mean of three numbers = $40$
Total number of observations = $3$
Lowest natural number = $19$
Solution:
First, find the sum of the three numbers:
$\text{Sum} = \text{Mean} \times \text{Count} = 40 \times 3 = 120$
Let the three different natural numbers be $x, y,$ and $z$, where $x < y < z$.
Given $x = 19$, we have:
$19 + y + z = 120$
$y + z = 120 - 19 = 101$
To make $z$ (the highest number) as large as possible, we must make $y$ as small as possible. Since the numbers are different natural numbers and $19$ is the lowest, the smallest possible value for $y$ is $20$.
Substituting $y = 20$:
$20 + z = 101$
$z = 101 - 20 = 81$
Thus, the highest possible number is $81$, which matches option (a).
Question 14. Khilona earned scores of 97, 73 and 88 respectively in her first three examinations. If she scored 80 in the fourth examination, then her average score will be
(a) increased by 1
(b) increased by 1.5
(c) decreased by 1
(d) decreased by 1.5
Answer:
Given:
Scores in first three exams: $97, 73, 88$
Score in fourth exam: $80$
Solution:
1. Initial Average:
$\text{Initial Sum} = 97 + 73 + 88 = 258$
$\text{Initial Average} = \frac{258}{3} = 86$
2. New Average:
$\text{New Sum} = 258 + 80 = 338$
$\text{New Average} = \frac{338}{4} = 84.5$
3. Comparison:
$\text{Difference} = 86 - 84.5 = 1.5$
Since the new average is lower, the average score is decreased by 1.5.
Thus, the correct option is (d).
Question 15. Which measure of central tendency best represents the data of the most popular politician after a debate?
(a) Mean
(b) Median
(c) Mode
(d) Any of the above
Answer:
Solution:
To determine who is the "most popular," we look for the politician who receives the highest number of votes or preferences. This is a measure of the most frequent response in a data set.
The mode is the measure of central tendency used to identify the most frequent observation.
Thus, the correct option is (c).
Question 16. Which of the following has the same mean, median and mode?
(a) 6, 2, 5, 4, 3, 4, 1
(b) 4, 2, 2, 1, 3, 2, 3
(c) 2, 3, 7, 3, 8, 3, 2
(d) 4, 3, 4, 3, 4, 6, 4
Answer:
Solution:
Let's check option (d):
Data: $4, 3, 4, 3, 4, 6, 4$
Mean:
$\text{Sum} = 4 + 3 + 4 + 3 + 4 + 6 + 4 = 28$
$\text{Mean} = \frac{28}{7} = 4$
Median:
Arrange in ascending order: $3, 3, 4, 4, 4, 4, 6$
Middle observation ($4^{th}$ term) is $4$.
Mode:
The number $4$ occurs $4$ times, which is the highest frequency. Thus, $\text{Mode} = 4$.
Since Mean = Median = Mode = 4, this data set satisfies the condition.
Thus, the correct option is (d).
Question 17 to 31 (Fill in the Blanks)
In Questions 17 to 31, fill in the blanks to make the statements true.
Question 17. The difference between the highest and the lowest observations of a data is called _________.
Answer:
Solution:
The difference between the highest and the lowest observations of a data is called its Range.
Question 18. The mean of a data is defined as _________.
Answer:
Solution:
The mean of a data is defined as the sum of all observations divided by the total number of observations.
Mathematically, it is expressed as:
$\text{Mean} = \frac{\text{Sum of all observations}}{\text{Total number of observations}}$
Question 19. In a set of observations, the observation that occurs the most often is called _________.
Answer:
Solution:
In a set of observations, the observation that occurs the most often is called the Mode.
Question 20. In a given data, arranged in ascending or descending order, the middle most observation is called _________.
Answer:
Solution:
In a given data, arranged in ascending or descending order, the middle-most observation is called the Median.
Question 21. Mean, Median, Mode are the measures of _________.
Answer:
Solution:
Mean, Median, and Mode are the measures of Central Tendency.
Question 22. The probability of an event which is certain to happen is _________.
Answer:
Solution:
The probability of an event which is certain to happen is $1$.
Question 23. The probability of an event which is impossible to happen is _________.
Answer:
Solution:
The probability of an event which is impossible to happen is $0$.
Question 24. When a die is thrown, the probability of getting a number less than 7 is _________.
Answer:
Solution:
When a standard die is thrown, the possible outcomes are $\{1, 2, 3, 4, 5, 6\}$.
Since all these numbers are less than $7$, every outcome is a favourable outcome.
$\text{Probability} = \frac{6}{6} = 1$
The probability of getting a number less than $7$ is $1$.
Question 25. In Throwing a die the number of possible outcomes is _________.
Answer:
A standard die is a cube with six faces, each marked with a different number from $1$ to $6$. When a die is thrown, the possible outcomes are $\{1, 2, 3, 4, 5, 6\}$.
In Throwing a die the number of possible outcomes is $6$.
Question 26. _________ can be used to compare two collections of data.
Answer:
To compare two different sets of data (such as marks of students in two different terms) simultaneously, we use a specific graphical tool.
Double bar graphs can be used to compare two collections of data.
Question 27. The representation of data with bars of uniform width is called _________.
Answer:
A visual representation of data where rectangular bars of equal width are drawn with heights proportional to the values they represent is a common statistical tool.
The representation of data with bars of uniform width is called bar graph.
Question 28. If the arithmetic mean of 8, 4, x, 6, 2, 7 is 5, then the value of x is _________.
Answer:
Given:
Observations: $8, 4, x, 6, 2, 7$
Number of observations ($n$) = $6$
Mean = $5$
To Find:
The value of $x$.
Solution:
We know that:
$\text{Mean} = \frac{\text{Sum of all observations}}{\text{Total number of observations}}$
Substituting the values:
$5 = \frac{8 + 4 + x + 6 + 2 + 7}{6}$
$5 \times 6 = 27 + x$
[Cross multiplication]
$30 = 27 + x$
$x = 30 - 27$
$x = 3$
If the arithmetic mean of $8, 4, x, 6, 2, 7$ is $5$, then the value of $x$ is $3$.
Question 29. The median of any data lies between the _________ and _________ observations.
Answer:
The median is a measure of central tendency. Since it represents the middle-most value of the data, it must fall within the range of the provided data points.
The median of any data lies between the lowest and highest observations.
Question 30. Median is one of the observations in the data if number of observations is _________.
Answer:
When we calculate the median of a data set with $n$ observations:
1. If $n$ is odd, the median is exactly the $\left( \frac{n+1}{2} \right)^{th}$ observation, which belongs to the data set.
2. If $n$ is even, the median is the average of two middle terms, which might not be a value present in the data.
Median is one of the observations in the data if number of observations is odd.
Question 31. Rohit collected the data regarding weights of students of his class and prepared the following table:
| Weight (in kg) | 44 - 47 | 48 - 51 | 52 - 55 | 56 - 60 |
|---|---|---|---|---|
| Number of Students | 3 | 5 | 25 | 7 |
A student is to be selected randomly from his class for some competition. The probability of selection of the student is highest whose weight is in the interval _________.
Answer:
Given Table:
| Weight (in kg) | 44 - 47 | 48 - 51 | 52 - 55 | 56 - 60 |
| Number of Students | 3 | 5 | 25 | 7 |
Analysis:
Probability is directly proportional to frequency in a random selection. The highest frequency in the table is $25$.
This frequency corresponds to the weight interval of $52 - 55$ kg.
A student is to be selected randomly from his class for some competition. The probability of selection of the student is highest whose weight is in the interval $52 - 55$.
Question 32 to 49 (True or False)
In Questions 32 to 49, state whether the statements are True or False.
Question 32. If a die is thrown, the probability of getting a number greater than 6 is 1.
Answer:
Solution:
A standard die has six faces numbered $1, 2, 3, 4, 5,$ and $6$. The maximum possible number is $6$.
Getting a number greater than $6$ is an impossible event.
The probability of an impossible event is $0$.
Therefore, the statement is False.
Question 33. When a coin is tossed, there are 2 possible outcomes.
Answer:
Solution:
When a coin is tossed, the possible outcomes are either a Head (H) or a Tail (T).
Thus, there are exactly $2$ possible outcomes.
Therefore, the statement is True.
Question 34. If the extreme observations on both the ends of a data arranged in ascending order are removed, the median gets affected.
Answer:
Solution:
The median is the middle-most value of an ordered data set.
If we remove one observation from the lowest end and one from the highest end, the center of the data remains at the same position.
The median is known for being a robust measure that is not affected by extreme values or outliers.
Therefore, the statement is False.
Question 35. The measures of central tendency may not lie between the maximum and minimum values of data.
Answer:
Solution:
Measures of central tendency (Mean, Median, and Mode) are values that represent the "center" of a data set.
By definition, these values always lie between the minimum (lowest) and maximum (highest) observations of the given data.
Therefore, the statement is False.
Question 36. It is impossible to get a sum of 14 of the numbers on both dice when a pair of dice is thrown together.
Answer:
Solution:
When two dice are thrown together, the maximum number on each die is $6$.
The maximum possible sum is $6 + 6 = 12$.
Since the maximum sum is $12$, it is impossible to obtain a sum of $14$.
Therefore, the statement is True.
Question 37. The probability of the spinning arrow stopping in the shaded region (Fig. 3.4) is $\frac{1}{2}$ .

Answer:
Solution:
Observe Fig. 3.4. The circular spinner is divided into $4$ equal sectors.
Out of these $4$ sectors, $2$ sectors are shaded.
$\text{Total outcomes} = 4$
$\text{Favourable outcomes (shaded)} = 2$
$\text{Probability} = \frac{2}{4}$
$\text{Probability} = \frac{1}{2}$
Therefore, the statement is True.
Question 38. A coin is tossed 15 times and the outcomes are recorded as follows :
| H | T | T | H | T | H | H | H | T | T |
| H | T | H | T | T |
The chance of occurence of a head is 50 per cent.
Answer:
Given:
Total tosses = $15$
Recorded outcomes: H, T, T, H, T, H, H, H, T, T, H, T, H, T, T
Solution:
Let's count the number of Heads (H) in the given data:
$\text{Count of H} = 7$
The chance (experimental probability) in percentage is calculated as:
$\text{Chance of Head} = \frac{\text{Number of Heads}}{\text{Total Tosses}} \times 100$
$\text{Chance} = \frac{7}{15} \times 100 \approx 46.67\%$
Since $46.67\%$ is not $50\%$, the statement is False.
Question 39. Mean, Median and Mode may be the same for some data.
Answer:
Solution:
In a perfectly symmetrical distribution (like the data set $\{2, 2, 2\}$ or $\{1, 2, 3, 3, 3, 4, 5\}$), the Mean, Median, and Mode can indeed be the same value.
Example: For the data $2, 2, 2$
$\text{Mean} = 2, \text{Median} = 2, \text{Mode} = 2$
Therefore, the statement is True.
Question 40. The probability of getting an ace out of a deck of cards is greater than 1.
Answer:
Solution:
In probability theory, the probability of any event $E$ is always bound by the range:
$0 \leq P(E) \leq 1$
The probability of an event can never be greater than 1.
Therefore, the statement is False.
Question 41. Mean of the data is always from the given data.
Answer:
The mean is the average of the observations. It is calculated as the sum of all values divided by the total count. This result does not necessarily have to be one of the values present in the data set.
For example, the mean of $1$ and $2$ is $\frac{1+2}{2} = 1.5$, which is not in the data.
Therefore, the statement is False.
Question 42. Median of the data may or may not be from the given data.
Answer:
When the number of observations is odd, the median is the middle observation, which is part of the data. However, when the number of observations is even, the median is the average of the two middle terms, which may not be a value from the data.
Therefore, the statement is True.
Question 43. Mode of the data is always from the given data.
Answer:
The mode is defined as the observation that occurs most frequently in a given data set. Since it must be a value that exists in the set to be counted as the most frequent, it is always one of the observations from the given data.
Therefore, the statement is True.
Question 44. Mean of the observations can be lesser than each of the observations.
Answer:
The mean represents the central value of the data. It always lies between the minimum and the maximum observations of the set. It cannot be smaller than the smallest observation.
Therefore, the statement is False.
Question 45. Mean can never be a fraction.
Answer:
The mean is a quotient of the sum of observations and the number of observations. If the sum is not perfectly divisible by the number of observations, the mean will be a fraction or a decimal.
Therefore, the statement is False.
Question 46. Range of the data is always from the data.
Answer:
The range is the difference between the highest and lowest observations. While the highest and lowest values are from the data, their difference (the range) does not have to be a value present in the data set.
For example, in the data $\{10, 20\}$, the range is $20 - 10 = 10$. But in $\{5, 12\}$, the range is $12 - 5 = 7$, which is not in the data.
Therefore, the statement is False.
Question 47. The data 12, 13, 14, 15, 16 has every observation as mode.
Answer:
The mode is the observation with the highest frequency. In the data $12, 13, 14, 15, 16$, every observation occurs exactly once. In such cases where all values have the same frequency, the data is said to have no mode.
Therefore, the statement is False.
Question 48. The range of the data 2, –5, 4, 3, 7, 6 would change if 2 was subtracted from each value in the data.
Answer:
The range is the difference between the maximum and minimum values. If we subtract a constant (like $2$) from every observation, both the maximum and minimum values decrease by the same amount.
$\text{New Range} = (\text{Max} - 2) - (\text{Min} - 2) = \text{Max} - \text{Min} $$ = \text{Original Range}$.
The range does not change when a constant is subtracted from all values.
Therefore, the statement is False.
Question 49. The range of the data 3, 7, 1, –2, 2, 6, –3, –5 would change if 8 was added to each value in the data.
Answer:
If a constant value (like $8$) is added to every observation in a data set, the difference between the new maximum and the new minimum remains the same as the original difference.
$\text{New Range} = (\text{Max} + 8) - (\text{Min} + 8) = \text{Max} - \text{Min} $$ = \text{Original Range}$.
The range remains unchanged when a constant is added to all values.
Therefore, the statement is False.
Question 50 to 91
Question 50. Calculate the Mean, Median and Mode of the following data:
| 5 | 10 | 10 | 12 | 13 |
Are these three equal ?
Answer:
Given:
Observations: $5, 10, 10, 12, 13$
Number of observations ($n$) = $5$
Solution:
1. To find the Mean:
$\text{Mean} = \frac{\text{Sum of all observations}}{\text{Total number of observations}}$
$\text{Sum} = 5 + 10 + 10 + 12 + 13 = 50$
$\text{Mean} = \frac{50}{5} = 10$
2. To find the Median:
Arranging the data in ascending order: $5, 10, 10, 12, 13$
Since $n = 5$ (odd), the Median is the $\left( \frac{5 + 1}{2} \right)^{th} = 3^{rd}$ observation.
$\text{Median} = 10$
3. To find the Mode:
Mode is the most frequent observation. Here, $10$ occurs twice, while other values occur once.
$\text{Mode} = 10$
Conclusion:
Since Mean = $10$, Median = $10$, and Mode = $10$, yes, all three measures are equal for this data.
Question 51. Find the mean of the first ten even natural numbers.
Answer:
Given:
The first ten even natural numbers are: $2, 4, 6, 8, 10, 12, 14, 16, 18, 20$.
Total number of observations ($n$) = $10$
Solution:
$\text{Mean} = \frac{\text{Sum of all observations}}{n}$
$\text{Sum} = 2 + 4 + 6 + 8 + 10 + 12 + 14 + 16 + 18 + 20$
$\text{Sum} = 110$
$\text{Mean} = \frac{110}{10} = 11$
The mean of the first ten even natural numbers is $11$.
Question 52. A data constitutes of heights (in cm) of 50 children. What do you understand by mode for the data?
Answer:
Solution:
In a data set containing the heights of $50$ children, the Mode represents the height that is most common among the children.
It identifies the specific height measurement that occurs with the highest frequency. For example, if $15$ out of $50$ children are exactly $140$ cm tall, and no other height value has a frequency greater than $15$, then $140$ cm is the mode.
Question 53. A car seller collects the following data of cars sold in his shop.
| Colour of Car | Number of Cars Sold |
|---|---|
| Red | 15 |
| Black | 20 |
| White | 17 |
| Silver | 12 |
| Others | 9 |
(a) Which colour of the car is most liked?
(b) Which measure of central tendency was used in (a)?
Answer:
Solution (a):
To find the most liked colour, we look for the colour with the highest number of sales (frequency). According to the table, the maximum number of cars sold is $20$.
This corresponds to the colour Black.
Solution (b):
The measure of central tendency that identifies the most frequent value in a data set is the Mode.
Question 54. The marks in a subject for 12 students are as follows:
| 31 | 37 | 35 | 38 | 42 | 23 | 17 | 18 | 35 | 25 |
| 35 | 29 |
For the given data, find the
(a) Range
(b) Mean
(c) Median
(d) Mode
Answer:
Given:
Data: $31, 37, 35, 38, 42, 23, 17, 18, 35, 25, 35, 29$
Number of observations ($n$) = $12$
Sorted Data: $17, 18, 23, 25, 29, 31, 35, 35, 35, 37, 38, 42$
Solution (a) Range:
$\text{Range} = \text{Highest Observation} - \text{Lowest Observation}$
$\text{Range} = 42 - 17 = 25$
Solution (b) Mean:
$\text{Sum} = 17+18+23+25+29+31+35+35+35+37+38+42 $$ = 365$
$\text{Mean} = \frac{365}{12} \approx 30.42$
Solution (c) Median:
Since $n=12$ (even), Median is the average of the $\left(\frac{12}{2}\right)^{th}$ and $\left(\frac{12}{2}+1\right)^{th}$ observations.
$6^{th}$ observation = $31$
$7^{th}$ observation = $35$
$\text{Median} = \frac{31 + 35}{2} = \frac{66}{2} = 33$
Solution (d) Mode:
The observation $35$ appears $3$ times, which is the highest frequency.
$\text{Mode} = 35$
Question 55. The following are weights (in kg) of 12 people.
| 70 | 62 | 54 | 57 | 62 | 84 | 75 | 59 | 62 | 65 |
| 78 | 60 |
(a) Find the mean of the weights of the people.
(b) How many people weigh above the mean weight?
(c) Find the range of the given data.
Answer:
Given:
Weights: $70, 62, 54, 57, 62, 84, 75, 59, 62, 65, 78, 60$
Number of people = $12$
Solution (a):
$\text{Sum of weights} = 70+62+54+57+62+84+75+59+62 $$ +65+78+60 = 788 \text{ kg}$
$\text{Mean} = \frac{788}{12} \approx 65.67 \text{ kg}$
Solution (b):
We need to count how many observations are greater than $65.67$.
Weights above mean: $70, 84, 75, 78$
The number of people is $4$.
Solution (c):
$\text{Highest weight} = 84 \text{ kg}$
$\text{Lowest weight} = 54 \text{ kg}$
$\text{Range} = 84 - 54 = 30 \text{ kg}$
Question 56. Following cards are put facing down:
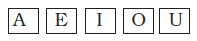
What is the chance of drawing out
(a) a vowel
(b) A or I
(c) a card marked U
(d) a consonant
Answer:
Given:
A set of cards with letters: A, E, I, O, U
$\text{Total number of cards } (n) = 5$
Solution:
The probability $P(E)$ of an event is calculated as:
$P(E) = \frac{\text{Number of favourable outcomes}}{\text{Total number of outcomes}}$
(a) A vowel:
All the letters in the set $\{A, E, I, O, U\}$ are vowels.
$\text{Favourable outcomes} = 5$
$P(\text{vowel}) = \frac{5}{5} = 1$
(b) A or I:
The favourable outcomes are $\{A, I\}$.
$\text{Favourable outcomes} = 2$
$P(A \text{ or } I) = \frac{2}{5}$
(c) A card marked U:
The favourable outcome is $\{U\}$.
$\text{Favourable outcomes} = 1$
$P(U) = \frac{1}{5}$
(d) A consonant:
There are no consonants in the set $\{A, E, I, O, U\}$.
$\text{Favourable outcomes} = 0$
$P(\text{consonant}) = \frac{0}{5} = 0$
Question 57. For the given data given below, calculate the mean of its median and mode.
| 6 | 2 | 5 | 4 | 3 | 4 | 4 | 2 | 3 |
Answer:
Given Data:
$6, 2, 5, 4, 3, 4, 4, 2, 3$
Total number of observations $(n) = 9$
Solution:
1. Finding the Mode:
Mode is the observation that appears most frequently.
$\text{Frequency of 4} = 3$
Since $4$ appears the most, Mode = 4.
2. Finding the Median:
First, arrange the data in ascending order:
$2, 2, 3, 3, 4, 4, 4, 5, 6$
Since $n = 9$ (odd), Median is the $\left( \frac{n + 1}{2} \right)^{th}$ term.
$\text{Median} = 5^{th} \text{ term} = 4$
3. Finding the Mean of Median and Mode:
$\text{Required Mean} = \frac{\text{Median} + \text{Mode}}{2}$
$\text{Required Mean} = \frac{4 + 4}{2} = \frac{8}{2} = 4$
The mean of the median and mode is $4$.
Question 58. Find the median of the given data if the mean is 4.5.
| 5 | 7 | 7 | 8 | x | 5 | 4 | 3 | 1 | 2 |
Answer:
Given:
Observations: $5, 7, 7, 8, x, 5, 4, 3, 1, 2$
Total observations $(n) = 10$
$\text{Mean} = 4.5$
To Find:
The value of $x$ and the Median.
Solution:
First, calculate $x$ using the mean formula:
$\text{Mean} = \frac{\text{Sum of observations}}{n}$
$4.5 = \frac{5 + 7 + 7 + 8 + x + 5 + 4 + 3 + 1 + 2}{10}$
$45 = 42 + x$
$x = 45 - 42 = 3$
Now, arrange the data in ascending order to find the Median:
$1, 2, 3, 3, 4, 5, 5, 7, 7, 8$
Since $n = 10$ (even), the median is the average of the $5^{th}$ and $6^{th}$ observations.
$\text{Median} = \frac{4 + 5}{2}$
$\text{Median} = \frac{9}{2} = 4.5$
The median of the given data is $4.5$.
Question 59. What is the probability of the sun setting tomorrow?
Answer:
Solution:
The setting of the sun is a universal truth and a certain event. It happens every day due to the rotation of the Earth.
The probability of an event that is certain to happen is always $1$.
Therefore, the probability of the sun setting tomorrow is $1$.
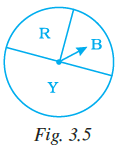
Question 60. When a spinner with three colours (Fig. 3.5) is rotated, which colour has more chance to show up with arrow than the others?
Answer:
Given:
A spinner divided into sectors representing colours: R (Red), B (Blue), and Y (Yellow).
Solution:
The chance of an arrow stopping on a specific colour depends on the area or the central angle of that colour's sector.
By observing Fig. 3.5, we can see that:
1. The sector for Yellow (Y) covers exactly half of the circular spinner ($180^\circ$).
2. The remaining half is shared between Red (R) and Blue (B).
Since the area covered by the Yellow colour is the largest compared to Red and Blue, the arrow has the highest probability of stopping in the Yellow region.
Thus, Yellow has more chance to show up than the others.
Question 61. What is the probability that a student chosen at random out of 3 girls and 4 boys is a boy?
Answer:
Given:
Number of girls = $3$
Number of boys = $4$
To Find:
Probability that a student chosen at random is a boy.
Solution:
First, we calculate the total number of students in the group:
$\text{Total number of students} = 3 + 4 = 7$
The probability $P(E)$ of choosing a boy is given by the formula:
$P(\text{Boy}) = \frac{\text{Number of favourable outcomes}}{\text{Total number of outcomes}}$
$\text{Number of favourable outcomes (boys)} = 4$
$\text{Total number of outcomes (students)} = 7$
$P(\text{Boy}) = \frac{4}{7}$
The probability that the chosen student is a boy is $\frac{4}{7}$.
Question 62. The letters written on paper slips of the word MEDIAN are put in a bag. If one slip is drawn randomly, what is the probability that it bears the letter D?
Answer:
Given:
Word: MEDIAN
Letters in the word: $M, E, D, I, A, N$
Solution:
Total number of letters in the word "MEDIAN" = $6$
Number of times the letter 'D' appears in the word = $1$
Probability $P(E)$ is defined as:
$P(D) = \frac{\text{Number of paper slips bearing D}}{\text{Total number of paper slips}}$
$P(D) = \frac{1}{6}$
The probability of drawing the letter D is $\frac{1}{6}$.
Question 63. Classify the following events as certain to happen, impossible to happen, may or may not happen:
(a) Getting a number less than 1 on throwing a die.
(b) Getting head when a coin is tossed.
(c) A team winning the match.
(d) Christmas will be on 25 December.
(e) Today moon will not revolve around the earth.
(f) A ball thrown up in the air will fall down after some time.
Answer:
Solution:
(a) Getting a number less than 1 on throwing a die:
A standard die has numbers from $1$ to $6$. There is no number less than $1$.
Classification: Impossible to happen.
(b) Getting head when a coin is tossed:
A coin can result in either a head or a tail. We cannot say for sure it will be a head.
Classification: May or may not happen.
(c) A team winning the match:
The result of a sports match is uncertain and depends on the game's outcome.
Classification: May or may not happen.
(d) Christmas will be on 25 December:
Christmas is a fixed annual date celebrated on December 25th.
Classification: Certain to happen.
(e) Today moon will not revolve around the earth:
The moon's revolution around the Earth is a constant natural law of physics.
Classification: Impossible to happen.
(f) A ball thrown up in the air will fall down after some time:
Due to the Earth's gravity, objects thrown up must return to the ground.
Classification: Certain to happen.
Question 64. A die was thrown 15 times and the outcomes recorded were
| 5 | 3 | 4 | 1 | 2 | 6 | 4 | 2 | 2 | 3 |
| 1 | 5 | 6 | 1 | 2 |
Find the mean, median and mode of the data.
Answer:
Given:
Observations: $5, 3, 4, 1, 2, 6, 4, 2, 2, 3, 1, 5, 6, 1, 2$
Total number of observations $(n) = 15$
Solution:
1. Mean:
$\text{Mean} = \frac{\text{Sum of all outcomes}}{n}$
Sum $= 5+3+4+1+2+6+4+2+2+3+1+5+6+1+2 = 47$
$\text{Mean} = \frac{47}{15} \approx 3.13$
2. Median:
First, arrange the data in ascending order:
$1, 1, 1, 2, 2, 2, 2, 3, 3, 4, 4, 5, 5, 6, 6$
Since $n = 15$ is odd, the median is the $\left(\frac{15+1}{2}\right)^{th}$ term.
$\text{Median} = 8^{th} \text{ term} = 3$
3. Mode:
The observation that occurs most frequently:
• $1$ appears $3$ times.
• $2$ appears $4$ times.
• $3, 4, 5, 6$ each appear $2$ times.
$\text{Mode} = 2$
Question 65. Find the mean of first six multiples of 4.
Answer:
Given:
The first six multiples of $4$ are: $4, 8, 12, 16, 20, 24$
Total number of observations $(n) = 6$
Solution:
$\text{Mean} = \frac{\text{Sum of all observations}}{n}$
$\text{Sum} = 4 + 8 + 12 + 16 + 20 + 24 = 84$
$\text{Mean} = \frac{84}{6}$
$\text{Mean} = 14$
The mean of the first six multiples of $4$ is $14$.
Question 66. Find the median of first nine even natural numbers.
Answer:
Given:
The first nine even natural numbers are: $2, 4, 6, 8, 10, 12, 14, 16, 18$
Number of observations ($n$) = $9$
To Find:
The median of the given data.
Solution:
The data is already arranged in ascending order: $2, 4, 6, 8, 10, 12, 14, 16, 18$.
Since the number of observations ($n$) is odd, the median is calculated using the following formula:
$\text{Median} = \left( \frac{n + 1}{2} \right)^{th} \text{ observation}$
Substituting $n = 9$:
$\text{Median} = \left( \frac{9 + 1}{2} \right)^{th} \text{ observation}$
$\text{Median} = \left( \frac{10}{2} \right)^{th} \text{ observation} = 5^{th} \text{ observation}$
In the ordered list, the $5^{th}$ observation is $10$.
The median of the first nine even natural numbers is $10$.
Question 67. The mean of three numbers is 10. The mean of other four numbers is 12. Find the mean of all the numbers.
Answer:
Given:
Mean of first three numbers ($n_1 = 3$) = $10$
Mean of other four numbers ($n_2 = 4$) = $12$
To Find:
Mean of all the numbers ($N = 3 + 4 = 7$).
Solution:
First, calculate the sum of the first set of numbers:
$\text{Sum of first three numbers} = \text{Mean} \times n_1$
$\text{Sum}_1 = 10 \times 3 = 30$
Next, calculate the sum of the second set of numbers:
$\text{Sum of next four numbers} = \text{Mean} \times n_2$
$\text{Sum}_2 = 12 \times 4 = 48$
Now, find the total sum and total count of numbers:
$\text{Total Sum} = 30 + 48 = 78$
$\text{Total numbers} (N) = 3 + 4 = 7$
Finally, find the combined mean:
$\text{Mean} = \frac{\text{Total Sum}}{\text{Total numbers}}$
$\text{Mean} = \frac{78}{7} = 11 \frac{1}{7} \approx 11.14$
The mean of all the numbers is $11.14$.
Question 68. Find the mode of the given data:
| 10 | 8 | 4 | 7 | 8 | 11 | 15 | 8 | 4 | 2 |
| 3 | 6 | 8 |
Answer:
Given:
Observations: $10, 8, 4, 7, 8, 11, 15, 8, 4, 2, 3, 6, 8$
Solution:
To find the Mode, let us count the frequency of each observation:
• $2$ appears $1$ time
• $3$ appears $1$ time
• $4$ appears $2$ times
• $6$ appears $1$ time
• $7$ appears $1$ time
• $8$ appears $4$ times
• $10$ appears $1$ time
• $11$ appears $1$ time
• $15$ appears $1$ time
The observation $8$ has the highest frequency of $4$.
The mode of the given data is $8$.
Question 69. Given below are heights of 15 boys of a class measured in cm:
| 128 | 144 | 146 | 143 | 136 | 142 | 138 | 129 | 140 | 152 |
| 144 | 140 | 150 | 142 | 154 |
Find
(a) The height of the tallest boy.
(b) The height of the shortest boy.
(c) The range of the given data.
(d) The median height of the boys.
Answer:
Given Data:
Heights (in cm): $128, 144, 146, 143, 136, 142, 138, 129, 140, 152, 144, 140, 150, 142, 154$
Number of boys ($n$) = $15$
Solution:
First, let's arrange the heights in ascending order:
$128, 129, 136, 138, 140, 140, 142, 142, 143, 144, 144, 146, 150, 152, 154$
(a) Height of the tallest boy:
The maximum value in the data is $154$ cm.
(b) Height of the shortest boy:
The minimum value in the data is $128$ cm.
(c) Range of the given data:
$\text{Range} = \text{Tallest height} - \text{Shortest height}$
$\text{Range} = 154 - 128 = 26$ cm
(d) Median height of the boys:
Since $n = 15$ (odd), Median is the $\left( \frac{15 + 1}{2} \right)^{th}$ observation.
$\text{Median} = 8^{th} \text{ observation}$
Looking at our sorted list, the $8^{th}$ value is $142$ cm.
Question 70. Observe the data and answer the questions that follow:
| 16 | 15 | 16 | 16 | 8 | 15 | 17 |
(a) Which data value can be put in the data so that the mode remains the same?
(b) At least how many and which value(s) must be put in to change the mode to 15?
(c) What is the least number of data values that must be put in to change the mode to 17? Name them.
Answer:
Analysis of current data:
Observations: $16, 15, 16, 16, 8, 15, 17$
Frequencies:
• $8$ appears $1$ time
• $15$ appears $2$ times
• $16$ appears $3$ times
• $17$ appears $1$ time
Current Mode = 16 (since it appears 3 times).
Solution (a):
To keep the mode as $16$, we can add any value that does not result in another number appearing $3$ or more times. However, adding $16$ itself is the most certain way to ensure the mode remains $16$. Other values like $8$ or $17$ could also be added once.
Solution (b):
Currently, $16$ appears $3$ times and $15$ appears $2$ times. To make $15$ the mode, its frequency must exceed the frequency of $16$.
We need at least two values of $15$. This would make the frequency of $15$ equal to $4$, while $16$ remains at $3$.
Solution (c):
Currently, $16$ appears $3$ times and $17$ appears only $1$ time. To make $17$ the mode, it must appear more times than $16$.
We need to add three values of $17$. This would make the frequency of $17$ equal to $4$ ($1$ original $+ 3$ added), making it the mode.
Question 71. Age (in years) of 6 children of two groups are recorded as below:
| Age (in Years) | |
| Group A | Group B |
|---|---|
| 7 | 7 |
| 7 | 9 |
| 9 | 11 |
| 8 | 12 |
| 10 | 12 |
| 10 | 12 |
(a) Find the mode and range for each group.
(b) Find the range and mode if the two groups are combined together.
Answer:
Given:
Age of children in Group A: $7, 7, 9, 8, 10, 10$
Age of children in Group B: $7, 9, 11, 12, 12, 12$
Solution (a):
For Group A:
Arranging in ascending order: $7, 7, 8, 9, 10, 10$
Mode: The values $7$ and $10$ both occur twice. Thus, it is bimodal.
$\text{Mode} = 7 \text{ and } 10 \text{ years}$
$\text{Range} = \text{Maximum} - \text{Minimum} = 10 - 7 = 3 \text{ years}$
For Group B:
Arranging in ascending order: $7, 9, 11, 12, 12, 12$
Mode: The value $12$ occurs three times.
$\text{Mode} = 12 \text{ years}$
$\text{Range} = 12 - 7 = 5 \text{ years}$
Solution (b):
Combined Data:
Combined ages: $7, 7, 9, 8, 10, 10, 7, 9, 11, 12, 12, 12$
Arranging in ascending order: $7, 7, 7, 8, 9, 9, 10, 10, 11, 12, 12, 12$
Mode: The values $7$ and $12$ both occur three times.
$\text{Mode} = 7 \text{ and } 12 \text{ years}$
$\text{Range} = 12 - 7 = 5 \text{ years}$
Question 72. Observe the given bar graph carefully and answer the questions that follow.
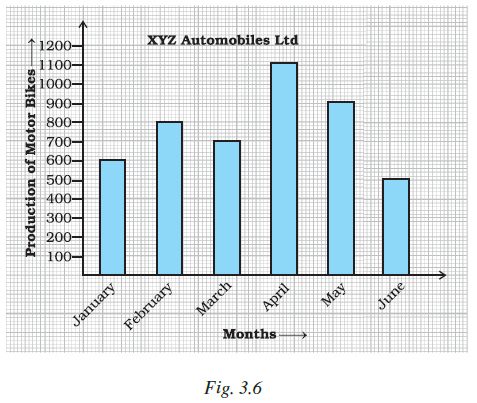
(a) What information does the bar graph depict?
(b) How many motor bikes were produced in the first three months?
(c) Calculate the increase in production in May over the production in January.
(d) In which month the production was minimum and what was it?
(e) Calculate the average (mean) production of bikes in 6 months.
Answer:
Solution:
(a) The bar graph depicts the monthly production of Motor Bikes by XYZ Automobiles Ltd over a period of six months (January to June).
(b) Production in the first three months:
January: $600$
February: $800$
March: $700$
$\text{Total} = 600 + 800 + 700 = 2100 \text{ bikes}$
(c) Increase in May over January:
Production in May = $900$
Production in January = $600$
$\text{Increase} = 900 - 600 = 300 \text{ bikes}$
(d) By observing the heights of the bars, the production was minimum in June, and it was $500$ bikes.
(e) Average production:
$\text{Total production} = 600 + 800 + 700 + 1100 + 900 + 500 = 4600 \text{ bikes}$
$\text{Mean} = \frac{4600}{6} \approx 766.67 \text{ bikes}$
Question 73. The bar graph given below shows the marks of students of a class in a particular subject:
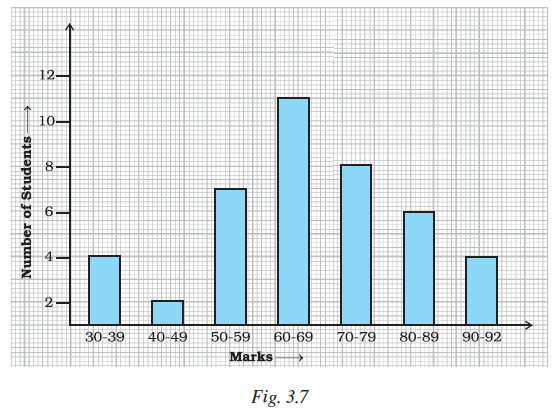
Study the bar graph and answer the following questions:
(a) If 40 is the pass mark, then how many students have failed?
(b) How many students got marks from 50 to 69?
(c) How many students scored 90 marks and above?
(d) If students who scored marks above 80 are given merits then how many merit holders are there?
(e) What is the strength of the class?
Answer:
Solution:
(a) If $40$ is the pass mark, students scoring in the $30-39$ interval failed. From the graph, there are $4$ such students.
(b) Students with marks $50$ to $69$ fall in the $50-59$ and $60-69$ intervals.
$\text{Number of students} = 7 + 11 = 18$
(c) Students scoring $90$ and above fall in the $90-92$ interval. There are $4$ such students.
(d) Merit holders (marks $> 80$) fall in the $80-89$ and $90-92$ intervals.
$\text{Merit holders} = 6 + 4 = 10$
(e) Strength of the class is the sum of frequencies of all intervals:
$\text{Strength} = 4 + 2 + 7 + 11 + 8 + 6 + 4 = 42 \text{ students}$
Question 74. Study the bar graph given below and answer the questions that follow.
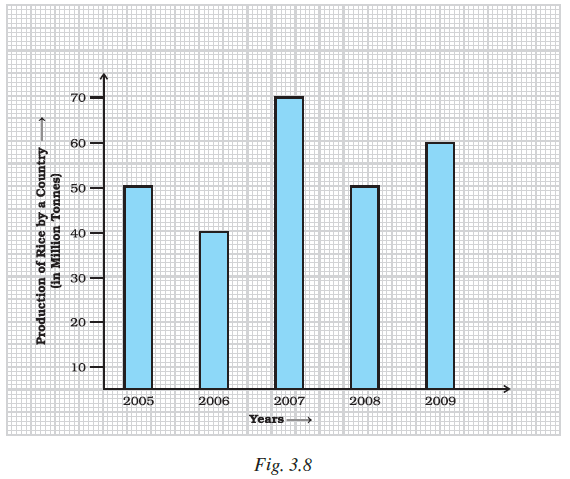
(a) What information does the above bar graph represent?
(b) In which year was production the least?
(c) After which year was the maximum rise in the production?
(d) Find the average production of rice during the 5 years.
(e) Find difference of rice production between years 2006 and 2008.
Answer:
Solution:
(a) The bar graph represents the annual production of rice by a country (in million tonnes) from the year $2005$ to $2009$.
(b) The production was least in the year $2006$ (with $40$ million tonnes).
(c) The maximum rise occurred from $2006$ to $2007$, where production jumped from $40$ to $70$ million tonnes. Thus, the rise was maximum after the year $2006$.
(d) Average production:
$\text{Total production} = 50 + 40 + 70 + 50 + 60 = 270 \text{ million tonnes}$
$\text{Average} = \frac{270}{5} = 54 \text{ million tonnes}$
(e) Production in 2006 = $40$ million tonnes
Production in 2008 = $50$ million tonnes
$\text{Difference} = 50 - 40 = 10 \text{ million tonnes}$
Question 75. Study the bar graph given below and answer the questions that follow :
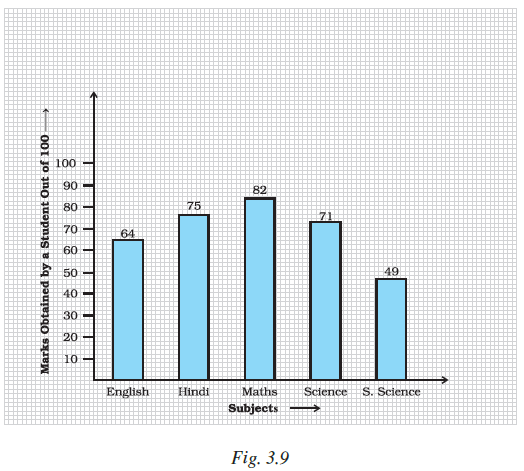
(a) What information is depicted from the bar graph?
(b) In which subject is the student very good?
(c) Calculate the average marks of the student.
(d) If 75 and above marks denote a distinction, then name the subjects in which the student got distinction.
(e) Calculate the percentage of marks the student got out of 500.
Answer:
Solution:
(a) The graph depicts the marks obtained by a student in five different subjects (English, Hindi, Maths, Science, S.Science) out of $100$ each.
(b) The student is very good in Maths, as it has the highest score of $82$.
(c) Average marks:
$\text{Total marks} = 64 + 75 + 82 + 71 + 49 = 341$
$\text{Average} = \frac{341}{5} = 68.2$
(d) Subjects with marks $\geq 75$ are Hindi ($75$) and Maths ($82$).
(e) Percentage Calculation:
$\text{Percentage} = \frac{\text{Total Marks}}{\text{Maximum Marks}} \times 100$
$\text{Percentage} = \frac{341}{500} \times 100 = 68.2\%$
Question 76. The bar graph given below represents the circulation of newspapers (dailies) in a town in six languages (the figures are approximated to hundreds).
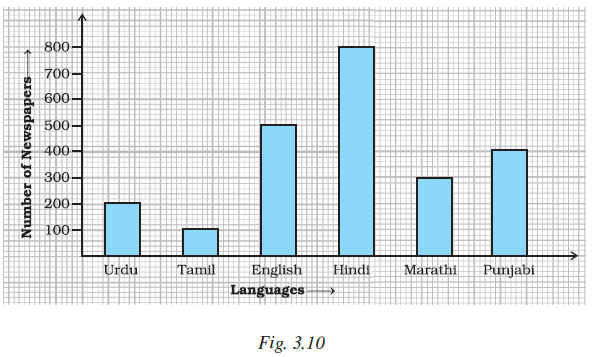
Study the bar graph and answer the following questions:
(a) Find the total number of newspapers read in Hindi, Punjabi, Urdu, Marathi and Tamil.
(b) Find the excess number of newspapers read in Hindi than those in English.
(c) Name the language in which the least number of newspapers are read.
(d) Write the total circulation of newspapers in the town.
Answer:
Solution:
Based on the observation of the bar graph (Fig. 3.10), the circulation numbers (in hundreds) for different languages are:
• Urdu: $200$
• Tamil: $100$
• English: $500$
• Hindi: $800$
• Marathi: $300$
• Punjabi: $400$
(a) Total newspapers in Hindi, Punjabi, Urdu, Marathi and Tamil:
$\text{Total} = 800 + 400 + 200 + 300 + 100$
$\text{Total} = 1800$
(b) Excess number of newspapers in Hindi than English:
$\text{Difference} = \text{Circulation in Hindi} - \text{Circulation in English}$
$\text{Difference} = 800 - 500 = 300$
(c) Language with the least circulation:
By observing the graph, the shortest bar corresponds to Tamil (with $100$ newspapers).
(d) Total circulation of newspapers in the town:
$\text{Total} = 200 + 100 + 500 + 800 + 300 + 400$
$\text{Total} = 2300$
Question 77. Study the double bar graphs given below and answer the following questions:
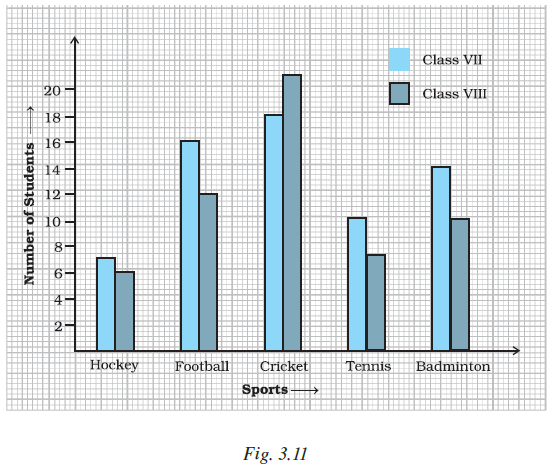
(a) Which sport is liked the most by Class VIII students?
(b) How many students of Class VII like Hockey and Tennis in all?
(c) How many students are there in Class VII?
(d) For which sport is the number of students of Class VII less than that of Class VIII?
(e) For how many sports students of Class VIII are less than Class VII?
(f) Find the ratio of students who like Badminton in Class VII to students who like Tennis in Class VIII.
Answer:
Solution:
From Fig. 3.11, the values for each class and sport are as follows:
| Sport | Class VII (Light Blue) | Class VIII (Dark Blue) |
| Hockey | 7 | 6 |
| Football | 16 | 12 |
| Cricket | 18 | 21 |
| Tennis | 10 | 7 |
| Badminton | 14 | 10 |
(a) The tallest dark blue bar is for Cricket ($21$ students). So, Cricket is liked the most by Class VIII.
(b) Total Class VII students liking Hockey and Tennis:
$\text{Total} = 7 \text{ (Hockey)} + 10 \text{ (Tennis)} = 17$ students.
(c) Total students in Class VII:
$\text{Total} = 7 + 16 + 18 + 10 + 14 = 65$ students.
(d) Comparing the bars, the Class VII bar is shorter than the Class VIII bar only for Cricket ($18 < 21$).
(e) Class VIII students are less than Class VII for Hockey, Football, Tennis, and Badminton. Total = $4$ sports.
(f) Ratio Calculation:
$\text{Class VII Badminton} = 14$
$\text{Class VIII Tennis} = 7$
$\text{Ratio} = \frac{14}{7} = \frac{2}{1}$
The ratio is $2 : 1$.
Question 78. Study the double bar graph shown below and answer the questions that follow:
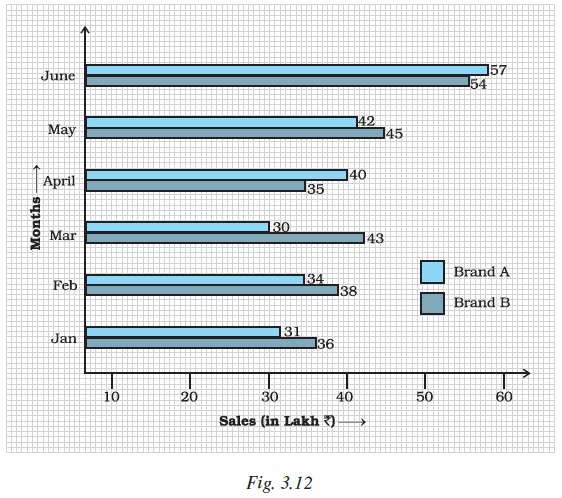
(a) What information is represented by the above double bar graph?
(b) In which month sales of Brand A decreased as compared to the previous month?
(c) What is the difference in sales of both the Brands for the month of June?
(d) Find the average sales of Brand B for the six months.
(e) List all months for which the sales of Brand B was less than that of Brand A.
(f) Find the ratio of sales of Brand A as compared to Brand B for the month of January.
Answer:
Solution:
(a) The graph represents a comparison of monthly sales (in Lakh $\textsf{₹}$) of two different brands, Brand A and Brand B, from January to June.
(b) Sales of Brand A (light blue): Jan ($31$), Feb ($34$), Mar ($30$). The sales decreased in March.
(c) Sales for June:
Brand A = $\textsf{₹}$ $57$ Lakh
Brand B = $\textsf{₹}$ $54$ Lakh
$\text{Difference} = 57 - 54 = \textsf{₹} 3$ Lakh.
(d) Average sales of Brand B:
$\text{Sum} = 36 + 38 + 43 + 35 + 45 + 54 = 251$
$\text{Mean} = \frac{251}{6} \approx \textsf{₹} 41.83$ Lakh.
(e) Sales of Brand B was less than Brand A in April (Brand B=$35$, Brand A=$40$) and June (Brand B=$54$, Brand A=$57$).
(f) Ratio for January:
Brand A = $31$, Brand B = $36$
The ratio is $31 : 36$.
Question 79. Study the double bar graph given below and answer the questions that follow:.
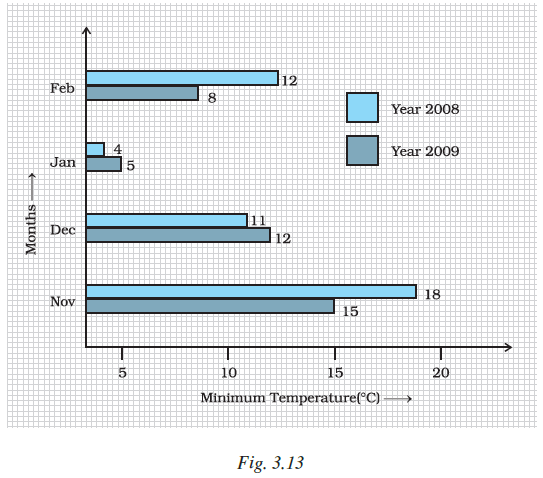
(a) What information is compared in the above given double bar graph?
(b) Calculate the ratio of minimum temperatures in the year 2008 to the year 2009 for the month of November.
(c) For how many months was the minimum temperature in the year 2008 greater than that of year 2009? Name those months.
(d) Find the average minimum temperature for the year 2008 for the four months.
(e) In which month is the variation in the two temperatures maximum?
Answer:
Solution:
(a) The graph compares the minimum temperatures (in $^\circ C$) across four months (November, December, January, and February) for the years 2008 and 2009.
(b) Ratio for November:
Temp in 2008 = $18^\circ C$
Temp in 2009 = $15^\circ C$
$\text{Ratio} = \frac{18}{15} = \frac{6}{5}$
The ratio is $6 : 5$.
(c) Temp (2008) $>$ Temp (2009) in:
1. November ($18 > 15$)
2. February ($12 > 8$)
Total = $2$ months (November and February).
(d) Average for 2008:
$\text{Sum} = 18 + 11 + 4 + 12 = 45$
$\text{Mean} = \frac{45}{4} = 11.25^\circ C$.
(e) Calculating variation (difference):
• Nov: $|18 - 15| = 3$
• Dec: $|11 - 12| = 1$
• Jan: $|4 - 5| = 1$
• Feb: $|12 - 8| = 4$
The variation is maximum in February.
Question 80. The following table shows the average intake of nutrients in calories by rural and urban groups in a particular year. Using a suitable scale for the given data, draw a double bar graph to compare the data.
| Foodstuff | Rural | Urban |
|---|---|---|
| Pulses | 35 | 49 |
| Leafy vegetables | 14 | 21 |
| Other vegetables | 51 | 89 |
| Fruits | 35 | 66 |
| Milk | 70 | 250 |
| Fish and flesh foods | 10 | 22 |
| Fats and Oils | 9 | 35 |
| Sugar/Jaggery | 19 | 31 |
Answer:
To Construct:
A double bar graph representing the comparison between rural and urban nutrient intake.
Proposed Scale:
On the Y-axis: $1$ unit $= 20$ calories.
On the X-axis: Foodstuff categories.
Graph Placeholder:
Summary Observation:
From the provided data, we can observe that the Urban group consistently has a higher intake of nutrients across all foodstuff categories compared to the Rural group, with the most significant difference seen in Milk intake.
Question 81. Study the double bar graph and answer the quesions that follow:

(a) What information does the double bar graph represent?
(b) Find the total number of boys in all sections of Class VII.
(c) In which sections, the number of girls is greater than the number of boys?
(d) In which section, the number of boys is the maximum?
(e) In which section, the number of girls is the least?
Answer:
Given:
A double bar graph representing the number of girls (light blue) and boys (dark blue) in different sections of Class VII (A, B, C, D, and E).
Solution:
(a) The double bar graph represents the comparison between the number of girls and the number of boys in five different sections of Class VII.
(b) Total number of boys in all sections:
From the graph, the number of boys in each section is:
VII A = $15$, VII B = $30$, VII C = $20$, VII D = $20$, VII E = $25$
$\text{Total Boys} = 15 + 30 + 20 + 20 + 25 = 110$
There are $110$ boys in total.
(c) Sections where Girls $>$ Boys:
Comparing the heights of the bars:
• In Section VII A: Girls ($20$) $>$ Boys ($15$)
• In Section VII D: Girls ($25$) $>$ Boys ($20$)
The sections are VII A and VII D.
(d) Section with maximum boys:
The tallest dark blue bar is for section VII B, which has $30$ boys.
(e) Section with least girls:
The shortest light blue bar is for section VII C, which has $15$ girls.
Question 82. In a public library, the following observations were recorded by the librarian in a particular week:
| Days | Mon | Tue | Wed | Thurs | Fri | Sat |
|---|---|---|---|---|---|---|
| Newspaper Readers | 400 | 600 | 350 | 550 | 500 | 350 |
| Magazine Readers | 150 | 100 | 200 | 300 | 250 | 200 |
(a) Draw a double bar graph choosing an appropriate scale.
(b) On which day, the number of readers in the library was maximum?
(c) What is the mean number of magazine readers?
Answer:
Solution (a):
To represent this data, we use a double bar graph where the X-axis represents the days and the Y-axis represents the number of readers.
Scale: $1$ unit on Y-axis $= 100$ readers.
Solution (b):
We calculate the total number of readers for each day:
• Mon: $400 + 150 = 550$
• Tue: $600 + 100 = 700$
• Wed: $350 + 200 = 550$
• Thurs: $550 + 300 = 850$
• Fri: $500 + 250 = 750$
• Sat: $350 + 200 = 550$
The total number of readers was maximum on Thursday ($850$).
Solution (c):
$\text{Sum of magazine readers} = 150 + 100 + 200 + 300 + 250 + 200 $$ = 1200$
$\text{Number of days} = 6$
$\text{Mean} = \frac{1200}{6}$
$\text{Mean} = 200$
The mean number of magazine readers is $200$.
Question 83. Observe the following data:
Government School, Chandpur Daily Attendance Date : 15.4.2009 |
||
| Class | Total Students | Number of Students Present on that Day |
|---|---|---|
| VI | 90 | 81 |
| VII | 82 | 76 |
| VIII | 95 | 91 |
| IX | 70 | 65 |
| X | 63 | 62 |
(a) Draw a double bar graph choosing an appropriate scale. What do you infer from the bar graph?
(b) Which class has the maximum number of students?
(c) In which class, the difference of total students and number of students present is minimum?
(d) Find the ratio of number of students present to the total number of students of Class IX.
(e) What per cent of Class VI students were absent?
Answer:
Solution (a):
Inference: From the double bar graph, we can infer that the attendance in the school is very high across all classes, as the bars for "Present" students are almost as tall as the "Total Students" bars.
Solution (b):
By looking at the "Total Students" column, Class VIII has the maximum number of students ($95$).
Solution (c):
Calculating the difference (Absent students) for each class:
• VI: $90 - 81 = 9$
• VII: $82 - 76 = 6$
• VIII: $95 - 91 = 4$
• IX: $70 - 65 = 5$
• X: $63 - 62 = 1$
The difference is minimum in Class X.
Solution (d):
For Class IX: Present $= 65$, Total $= 70$.
$\text{Ratio} = \frac{65}{70} = \frac{\cancel{65}^{13}}{\cancel{70}_{14}}$
The ratio is $13 : 14$.
Solution (e):
For Class VI: Total $= 90$, Absent $= 9$.
$\text{Percentage Absent} = \left( \frac{9}{90} \right) \times 100\%$
$\text{Percentage Absent} = \frac{1}{10} \times 100\% = 10\%$
$10\%$ of Class VI students were absent.
Question 84. Observe the given data:
| Days of the Week | Mon | Tue | Wed | Thurs | Fri | Sat |
|---|---|---|---|---|---|---|
| Number of Mobile Phone Sets Sold | 50 | 45 | 30 | 55 | 27 | 60 |
(a) Draw a bar graph to represent the above given information.
(b) On which day of the week was the sales maximum?
(c) Find the total sales during the week.
(d) Find the ratio of the minimum sale to the maximum sale.
(e) Calculate the average sale during the week.
(f) On how many days of the week was the sale above the average sales?
Answer:
Solution (a):
Scale: On Y-axis, $1$ unit $= 10$ mobile sets.
Solution (b):
The maximum number of mobile sets sold was $60$, which occurred on Saturday.
Solution (c):
$\text{Total sales} = 50 + 45 + 30 + 55 + 27 + 60 = 267$
The total sales for the week is $267$ units.
Solution (d):
Minimum sale = $27$ (Friday); Maximum sale = $60$ (Saturday).
$\text{Ratio} = \frac{27}{60} = \frac{\cancel{27}^{9}}{\cancel{60}_{20}}$
The ratio is $9 : 20$.
Solution (e):
$\text{Average sale} = \frac{\text{Total sales}}{\text{Number of days}} = \frac{267}{6}$
$\text{Average sale} = 44.5$ units.
Solution (f):
Days with sales $> 44.5$ are: Monday ($50$), Tuesday ($45$), Thursday ($55$), and Saturday ($60$).
Total = $4$ days.
Question 85. Below is a list of 10 tallest buildings in India.
This list ranks buildings in India that stand at least 150m (492 ft.) tall, based on standard height measurement. This includes spires and architectural details but does not include antenna marks. Following data is given as per the available information till 2009. Since new buildings are always under construction, go on-line to check new taller buildings.
Use the information given in the table about sky scrapers to answer the following questions:
| Name | City | Height | Floors | Year |
|---|---|---|---|---|
| Planet | Mumbai | 181 m | 51 | 2009 |
| UB Tower | Bengluru | 184 m | 20 | 2006 |
| Ashok Towers | Mumbai | 193 m | 49 | 2009 |
| The Impertal I | Mumbai | 249 m | 60 | 2009 |
| The Impertal II | Mumbai | 249 m | 60 | 2009 |
| RNA Mirage | Mumbai | 180 m | 40 | 2009 |
| Oberoi Woods Tower I | Mumbai | 170 m | 40 | 2009 |
| Oberoi Woods Tower II | Mumbai | 170 m | 40 | 2009 |
| Oberoi Woods Tower III | Mumbai | 170 m | 40 | 2009 |
| MVRDC | Mumbai | 156 m | 35 | 2002 |
(a) Find the height of each storey of the three tallest buildings and write them in the following table:
| Building | Height | Number of Storeys | Height of Each Storeys |
|---|---|---|---|
(b) The average height of one storey for the buildings given in (a) is ______________.
(c) Which city in this list has the largest percentage of skyscrappers? What is the percentage ?
(d) What is the range of data?
(e) Find the median of the data.
(f) Draw a bar graph for given data.
Answer:
Solution (a):
The three tallest buildings are The Imperial I, The Imperial II, and Ashok Towers.
| Building | Height ($m$) | Number of Storeys | Height of Each Storey ($m$) |
|---|---|---|---|
| The Imperial I | 249 | 60 | $4.15$ |
| The Imperial II | 249 | 60 | $4.15$ |
| Ashok Towers | 193 | 49 | $3.94$ |
Solution (b):
$\text{Average} = \frac{4.15 + 4.15 + 3.94}{3} = \frac{12.24}{3} = 4.08$ m.
Solution (c):
Out of $10$ buildings, $9$ are in Mumbai.
$\text{Percentage} = \left( \frac{9}{10} \right) \times 100\% = 90\%$.
Solution (d):
$\text{Range} = 249 \text{ m} - 156 \text{ m} = 93 \text{ m}$.
Solution (e):
Sorted heights: $156, 170, 170, 170, 180, 181, 184, 193, 249, 249$
$\text{Median} = \frac{180 + 181}{2} = 180.5 \text{ m}$.
Solution (f):
Question 86. The marks out of 100 obtained by Kunal and Soni in the Half Yearly Examination are given below:
| Subjects | English | Hindi | Maths | Science | S.Science | Sanskrit |
|---|---|---|---|---|---|---|
| Krunal | 72 | 81 | 92 | 96 | 64 | 85 |
| Soni | 86 | 89 | 90 | 82 | 75 | 82 |
(a) Draw a double bar graph by choosing appropriate scale.
(b) Calculate the total percentage of marks obtained by Soni.
(c) Calculate the total percentage of marks obtained by Kunal.
(d) Compare the percentages of marks obtained by Kunal and Soni.
(e) In how many subjects did Soni get more marks than Kunal? Which are those subjects?
(f) Who got more marks in S. Science and what was the difference of marks?
(g) In which subject the difference of marks was maximum and by how much?
Answer:
Given:
Marks of Kunal and Soni in 6 subjects (each out of 100).
Solution (a):
Solution (b):
Total marks of Soni = $86 + 89 + 90 + 82 + 75 + 82 = 504$
Maximum Marks = $600$
$\text{Percentage of Soni} = \frac{504}{600} \times 100 = 84\%$
Solution (c):
Total marks of Kunal = $72 + 81 + 92 + 96 + 64 + 85 = 490$
$\text{Percentage of Kunal} = \frac{490}{600} \times 100 \approx 81.67\%$
Solution (d):
Soni ($84\%$) has a higher percentage than Kunal ($81.67\%$). The difference is $2.33\%$.
Solution (e):
Soni got more marks than Kunal in 3 subjects: English, Hindi, and S. Science.
Solution (f):
In S. Science, Soni got $75$ and Kunal got $64$.
Soni got more marks. Difference = $75 - 64 = 11$ marks.
Solution (g):
Calculating differences in each subject:
Eng ($14$), Hindi ($8$), Maths ($2$), Science ($14$), S.S. ($11$), Sanskrit ($3$).
The difference was maximum in English and Science by 14 marks.
Question 87. The students of Class VII have to choose one club from Music, Dance, Yoga, Dramatics, Fine arts and Electronics clubs. The data given below shows the choices made by girls and boys of the class. Study the table and answer the questions that follow:
| Clubs | Music | Dance | Yoga | Dramatics | Fine Arts | Electronics |
|---|---|---|---|---|---|---|
| Girls | 15 | 24 | 10 | 19 | 27 | 21 |
| Boys | 12 | 16 | 8 | 17 | 11 | 30 |
(a) Draw a double bar graph using appropriate scale to depict the above data.
(b) How many students are there in Class VII?
(c) Which is the most preferred club by boys?
(d) Which is the least preferred club by girls?
(e) For which club the difference between boys and girls is the least?
(f) For which club is the difference between boys and girls the maximum?
Answer:
Solution (a):
Solution (b):
Total Girls = $15 + 24 + 10 + 19 + 27 + 21 = 116$
Total Boys = $12 + 16 + 8 + 17 + 11 + 30 = 94$
$\text{Total Students} = 116 + 94 = 210$
Solution (c):
The highest number for boys is $30$ in the Electronics club.
Solution (d):
The lowest number for girls is $10$ in the Yoga club.
Solution (e):
Comparing absolute differences: Music ($3$), Dance ($8$), Yoga ($2$), Dramatics ($2$), Fine Arts ($16$), Electronics ($9$).
The difference is least for Yoga and Dramatics (both 2).
Solution (f):
The maximum difference is in Fine Arts ($27 - 11 = 16$).
Question 88. The data given below shows the production of motor bikes in a factory for some months of two consecutive years.
| Months | Feb | May | August | October | December |
|---|---|---|---|---|---|
| 2008 | 2700 | 3200 | 6000 | 5000 | 4200 |
| 2007 | 2800 | 4500 | 4800 | 4800 | 5200 |
Study the table given above and answer the following questions:
(a) Draw a double bar graph using appropriate scale to depict the above information and compare them.
(b) In which year was the total output the maximum?
(c) Find the mean production for the year 2007.
(d) For which month was the difference between the production for the two years the maximum?
(e) In which month for the year 2008, the production was the maximum?
(f) In which month for the year 2007, the production was the least?
Answer:
Given:
Monthly production of motor bikes for the years 2007 and 2008.
Solution (a):
To compare the production, we draw a double bar graph. We choose a scale of $1$ unit $= 1000$ motor bikes on the Y-axis.
Solution (b):
First, we calculate the total production for each year:
$\text{Total for 2008} = 2700 + 3200 + 6000 + 5000 + 4200 = 21100 \text{ units}$
$\text{Total for 2007} = 2800 + 4500 + 4800 + 4800 + 5200 = 22100 \text{ units}$
Since $22100 > 21100$, the total output was maximum in the year 2007.
Solution (c):
$\text{Mean (2007)} = \frac{\text{Total Production}}{\text{Number of Months}}$
$\text{Mean (2007)} = \frac{22100}{5} = 4420$
The mean production for the year 2007 was $4420$ units.
Solution (d):
We find the absolute difference for each month:
• Feb: $|2700 - 2800| = 100$
• May: $|3200 - 4500| = 1300$
• Aug: $|6000 - 4800| = 1200$
• Oct: $|5000 - 4800| = 200$
• Dec: $|4200 - 5200| = 1000$
The difference was maximum in May.
Solution (e):
In 2008, the highest production value is $6000$. This occurred in August.
Solution (f):
In 2007, the lowest production value is $2800$. This occurred in February.
Question 89. The table below compares the population (in hundreds) of 4 towns over two years:
| Towns | A | B | C | D |
|---|---|---|---|---|
| 2007 | 2900 | 6400 | 8300 | 4600 |
| 2009 | 3200 | 7500 | 9200 | 6300 |
Study the table and answer the following questions:
(a) Draw a double bar graph using appropriate scale to depict the above information.
(b) In which town was the population growth maximum?
(c) In which town was the population growth least?
Answer:
Given:
Population data (in hundreds) for four towns (A, B, C, D) in 2007 and 2009.
Solution (a):
Scale: On Y-axis, $1$ unit $= 1000$ hundred people.
Solution (b):
Population growth is calculated as $\text{Population (2009)} - \text{Population (2007)}$:
• Town A: $3200 - 2900 = 300$
• Town B: $7500 - 6400 = 1100$
• Town C: $9200 - 8300 = 900$
• Town D: $6300 - 4600 = 1700$
The population growth was maximum in Town D.
Solution (c):
From the calculations above, the smallest increase in population occurred in Town A ($300$).
Question 90. The table below gives the data of tourists visiting 5 hill stations over two consecutive years. Study the table and answer the questions that follow:
| Hill stations | Nainital | Shimla | Manali | Mussoorie | Kullu |
|---|---|---|---|---|---|
| 2008 | 4000 | 5200 | 3700 | 5800 | 3500 |
| 2009 | 4800 | 4500 | 4200 | 6200 | 4600 |
(a) Draw a double bar graph to depict the above information using appropriate scale.
(b) Which hill station was visited by the maximum number of tourists in 2008?
(c) Which hill station was visited by the least number of tourists in 2009?
(d) In which hill stations was there increase in number of tourists in the year 2009?
Answer:
Given:
Data of tourists for five hill stations in 2008 and 2009.
Solution (a):
Scale: On Y-axis, $1$ unit $= 1000$ tourists.
Solution (b):
Comparing the values for 2008:
Nainital ($4000$), Shimla ($5200$), Manali ($3700$), Mussoorie ($5800$), Kullu ($3500$).
Mussoorie was visited by the maximum number of tourists in 2008.
Solution (c):
Comparing the values for 2009:
Nainital ($4800$), Shimla ($4500$), Manali ($4200$), Mussoorie ($6200$), Kullu ($4600$).
Manali was visited by the least number of tourists in 2009.
Solution (d):
We check where $\text{Value (2009)} > \text{Value (2008)}$:
• Nainital: $4800 > 4000$ (Increase)
• Shimla: $4500 < 5200$ (Decrease)
• Manali: $4200 > 3700$ (Increase)
• Mussoorie: $6200 > 5800$ (Increase)
• Kullu: $4600 > 3500$ (Increase)
There was an increase in Nainital, Manali, Mussoorie, and Kullu.
Question 91. The table below gives the flavours of ice cream liked by children (boys and girls) of a society.
| Flavours | Vanilla | Chocolate | strawberry | Mango | Butterscotch |
|---|---|---|---|---|---|
| Boys | 4 | 9 | 3 | 8 | 13 |
| Girls | 8 | 12 | 7 | 9 | 10 |
Study the table and answer the following questions:
(a) Draw a double bar graph using appropriate scale to represent the above information.
(b) Which flavour is liked the most by the boys?
(c) How many girls are there in all?
(d) How many children like chocolate flavour of ice cream?
(e) Find the ratio of children who like strawberry flavour to vanilla flavour of ice cream.
Answer:
Given:
Ice cream flavour preferences categorized by gender.
Solution (a):
Scale: On Y-axis, $1$ unit $= 2$ children.
Solution (b):
Comparing the numbers for boys: Vanilla ($4$), Chocolate ($9$), Strawberry ($3$), Mango ($8$), Butterscotch ($13$).
Butterscotch is the flavour liked most by the boys.
Solution (c):
Total Girls $= 8 + 12 + 7 + 9 + 10$
Total Girls $= 46$
There are $46$ girls in total.
Solution (d):
Children liking Chocolate $= \text{Boys} + \text{Girls}$
Children liking Chocolate $= 9 + 12 = 21$
$21$ children like chocolate flavour.
Solution (e):
1. Strawberry liking children: $3 \text{ (Boys)} + 7 \text{ (Girls)} = 10$
2. Vanilla liking children: $4 \text{ (Boys)} + 8 \text{ (Girls)} = 12$
$\text{Ratio} = \frac{10}{12}$
$\text{Ratio} = \frac{5}{6}$
The ratio is $5 : 6$.