

Chapter 12 Introduction to Graphs (Class 8 - Maths NCERT Exemplar Solutions)
Welcome to the comprehensive resource for NCERT Exemplar Solutions for Class 8 Mathematics: Chapter 12 Introduction to Graphs! This chapter is intentionally crafted to move beyond basic graph-reading exercises, aiming to significantly enhance students' graphical literacy. By focusing on the Cartesian coordinate system, these problems challenge learners to interpret, analyze, and construct graphs that represent complex real-world data sets, providing deeper insights into the relationships between variables.
The solutions reinforce the foundational understanding of the coordinate plane, including the horizontal x-axis, the vertical y-axis, and the origin $(0, 0)$. Students will master the precision required for plotting points $(x, y)$ and identifying their locations within specific quadrants or on the axes. A major focus is placed on interpreting various graph types, such as Line Graphs for continuous trends and Linear Graphs for direct proportional relationships, often seen in Quantity-Cost scenarios involving the $\textsf{₹}$ symbol.
A key highlight of this chapter is the Distance-Time Graph, where students learn to analyze the slope of line segments to determine speed. The solutions also provide detailed guidance on constructing graphs from data tables, emphasizing the critical skill of choosing an appropriate scale for both axes. With step-by-step instructions and logical justifications prepared by learningspot.co, students can accurately visualize data fluctuations, identify patterns, and communicate quantitative insights effectively in diverse academic and real-life contexts.
Solved Examples (Examples 1 to 13)
In examples 1 and 2, there are four options out of which one is correct. Write the correct answer.
Example 1: Every point on the x axis is of the form.
(a) (0, y)
(b) (x, 0)
(c) (x, y)
(d) (x, 1)
Answer:
The x-axis is the horizontal axis in a Cartesian coordinate system.
A point on the x-axis has its y-coordinate equal to $0$.
Therefore, any point on the x-axis must be of the form $(x, 0)$, where $x$ is any real number.
Looking at the given options:
(a) $(0, y)$ represents points on the y-axis.
(b) $(x, 0)$ represents points on the x-axis.
(c) $(x, y)$ represents any point in the plane.
(d) $(x, 1)$ represents points on the line $y=1$, parallel to the x-axis.
Thus, the correct form for every point on the x-axis is $(x, 0)$.
The correct answer is (b) (x, 0).
Example 2: The given graph shows Nisha’s trip to a mall by a car. Observe the graph carefully and find what was she doing between 5 pm and 7 pm?

(a) Driving to the mall.
(b) Driving back home.
(c) Was not driving.
(d) Not enough data to answer.
Answer:
To understand what Nisha was doing between 5 pm and 7 pm, we need to observe the graph in that specific time interval.
In a distance-time graph, the slope of the line segment represents the speed.
If the distance from the starting point is increasing with time, it means she is driving away from home (e.g., towards the mall).
If the distance is decreasing with time, it means she is driving back towards home.
If the distance remains constant over a period of time, the line segment is horizontal, indicating that her position is not changing, and therefore, she is not driving.
Assuming the graph shows a horizontal line segment between 5 pm and 7 pm, the distance from her starting point remains constant during this time.
This implies that she was stationary or not driving during this period.
Based on the options:
(a) Driving to the mall would show increasing distance.
(b) Driving back home would show decreasing distance.
(c) Was not driving indicates constant distance.
(d) The graph provides data about her location at different times.
Therefore, if the distance is constant between 5 pm and 7 pm, she was not driving.
The correct answer is (c) Was not driving.
In examples 3 and 4, fill in the blanks to make the statements true.
Example 3: In a __________ graph, all the points on the graph lie on the same straight line.
Answer:
A graph where all the points plotted based on given data form a straight line is called a linear graph.
The relationship represented by such a graph is a linear relationship.
Therefore, the statement should be: In a linear graph, all the points on the graph lie on the same straight line.
The correct answer is linear.
Example 4: The coordinates of the origin are ___________
Answer:
In a Cartesian coordinate system, the origin is the point where the x-axis and the y-axis intersect.
This point is the reference point $(0, 0)$ from which all other points are located.
The first coordinate (x-coordinate) of the origin is $0$, as it lies on the y-axis.
The second coordinate (y-coordinate) of the origin is $0$, as it lies on the x-axis.
Therefore, the coordinates of the origin are $(0, 0)$.
The correct answer is (0, 0).
In examples 5 and 6, state whether the statements are true (T) or false (F).
Example 5: Points (3, 4) and (4, 3) represent the same point on the graph.
Answer:
In a Cartesian coordinate system, a point is represented by an ordered pair $(x, y)$, where $x$ is the x-coordinate (abscissa) and $y$ is the y-coordinate (ordinate).
The order of the coordinates is important.
The point $(3, 4)$ means the point is located $3$ units from the origin along the x-axis and $4$ units from the origin along the y-axis.
The point $(4, 3)$ means the point is located $4$ units from the origin along the x-axis and $3$ units from the origin along the y-axis.
Since the x and y coordinates are different for the two points $(3, 4)$ and $(4, 3)$, they represent distinct locations on the graph.
For example, to reach (3, 4), you move 3 units right and 4 units up from the origin.
To reach (4, 3), you move 4 units right and 3 units up from the origin.
These are clearly different points.
Therefore, the statement is false.
The correct answer is False (F).
Example 6: The y coordinate of any point lying on the x axis will be 0.
Answer:
In a Cartesian coordinate system, a point is uniquely identified by its ordered pair $(x, y)$, where $x$ is the x-coordinate (abscissa) and $y$ is the y-coordinate (ordinate).
The x-axis is the horizontal line in the coordinate plane.
The y-coordinate of a point represents its vertical distance from the x-axis.
If a point lies exactly on the x-axis, its vertical distance from the x-axis is zero.
Therefore, for any point $(x, y)$ located on the x-axis, the y-coordinate must be $0$.
Points on the x-axis are of the form $(x, 0)$, where $x$ is any real number.
This confirms that the y-coordinate of any point lying on the x-axis is indeed $0$.
Therefore, the statement is true.
The correct answer is True (T).
Example 7: Plot the points (4, 4), (1, 3), (4, 2) and (7, 3) on a graph paper and connect them with line segments. Name the shape formed by these points.
Answer:
Let the given points be A(4, 4), B(1, 3), C(4, 2), and D(7, 3).
When these points are plotted on a graph paper and connected in the given order (A to B, B to C, C to D, and D to A), they form a quadrilateral ABCD.
To identify the shape, we can examine its properties.
Let's consider the lengths of the sides using the distance formula $\sqrt{(x_2 - x_1)^2 + (y_2 - y_1)^2}$.
Length of AB = $\sqrt{(1-4)^2 + (3-4)^2} = \sqrt{(-3)^2 + (-1)^2} = \sqrt{9+1} = \sqrt{10}$
Length of BC = $\sqrt{(4-1)^2 + (2-3)^2} = \sqrt{(3)^2 + (-1)^2} = \sqrt{9+1} = \sqrt{10}$
Length of CD = $\sqrt{(7-4)^2 + (3-2)^2} = \sqrt{(3)^2 + (1)^2} = \sqrt{9+1} = \sqrt{10}$
Length of DA = $\sqrt{(4-7)^2 + (4-3)^2} = \sqrt{(-3)^2 + (1)^2} = \sqrt{9+1} = \sqrt{10}$
Since all four sides of the quadrilateral are equal in length, it could be a rhombus or a square.
Let's check the slopes of the sides using the slope formula $\frac{y_2 - y_1}{x_2 - x_1}$.
Slope of AB = $\frac{3-4}{1-4} = \frac{-1}{-3} = \frac{1}{3}$
Slope of BC = $\frac{2-3}{4-1} = \frac{-1}{3}$
Slope of CD = $\frac{3-2}{7-4} = \frac{1}{3}$
Slope of DA = $\frac{4-3}{4-7} = \frac{1}{-3} = -\frac{1}{3}$
Since Slope of AB = Slope of CD ($\frac{1}{3}$), AB is parallel to CD.
Since Slope of BC = Slope of DA ($-\frac{1}{3}$), BC is parallel to DA.
As opposite sides are parallel, the quadrilateral ABCD is a parallelogram.
A parallelogram with all sides equal is a rhombus.
To confirm it's not a square, we can check if the adjacent sides are perpendicular. The product of slopes of perpendicular lines is $-1$.
Slope of AB $\times$ Slope of BC = $\frac{1}{3} \times (-\frac{1}{3}) = -\frac{1}{9}$. Since $-\frac{1}{9} \neq -1$, AB is not perpendicular to BC. Thus, there are no right angles, and the shape is not a square.
Alternatively, consider the diagonals AC and BD.
Diagonal AC connects A(4, 4) and C(4, 2). This is a vertical line segment since the x-coordinates are the same.
Diagonal BD connects B(1, 3) and D(7, 3). This is a horizontal line segment since the y-coordinates are the same.
Since the diagonals are vertical and horizontal, they are perpendicular to each other.
Let's find the midpoint of the diagonals.
Midpoint of AC = $(\frac{4+4}{2}, \frac{4+2}{2}) = (\frac{8}{2}, \frac{6}{2}) = (4, 3)$.
Midpoint of BD = $(\frac{1+7}{2}, \frac{3+3}{2}) = (\frac{8}{2}, \frac{6}{2}) = (4, 3)$.
Since the midpoints coincide, the diagonals bisect each other, confirming it is a parallelogram.
A parallelogram whose diagonals are perpendicular is a rhombus.
Therefore, the shape formed by these points is a rhombus.
Example 8: Write the coordinates of all the points in the given graph.
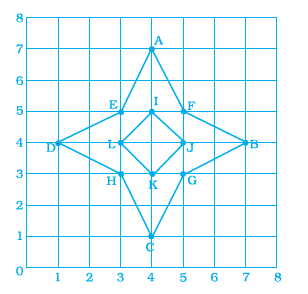
Answer:
To find the coordinates of a point on a graph, we first determine its position along the x-axis (the horizontal axis) and then its position along the y-axis (the vertical axis).
The coordinates are written as an ordered pair $(x, y)$, where $x$ is the x-coordinate and $y$ is the y-coordinate.
By observing the given graph and the positions of the labeled points, we can determine their coordinates:
Point A is located 4 units to the right of the origin on the x-axis. Its coordinates are $(4, 0)$.
Point B is located 4 units above the origin on the y-axis. Its coordinates are $(0, 4)$.
Point C is located 4 units to the right of the origin and 2 units up from the origin. Its coordinates are $(4, 2)$.
Point D is located 5 units to the right of the origin on the x-axis. Its coordinates are $(5, 0)$.
Point E is located 5 units to the right of the origin and 5 units up from the origin. Its coordinates are $(5, 5)$.
Point F is located 5 units above the origin on the y-axis. Its coordinates are $(0, 5)$.
Point G is located 2 units to the right of the origin and 1 unit up from the origin. Its coordinates are $(2, 1)$.
Point H is located 1 unit to the right of the origin and 2 units up from the origin. Its coordinates are $(1, 2)$.
Point P is located 3 units to the right of the origin and 3 units up from the origin. Its coordinates are $(3, 3)$.
Point Q is located 6 units to the right of the origin and 3 units up from the origin. Its coordinates are $(6, 3)$.
Point R is located 5 units to the right of the origin and 6 units up from the origin. Its coordinates are $(5, 6)$.
Point S is located 2 units to the right of the origin and 5 units up from the origin. Its coordinates are $(2, 5)$.
Point T is located 3 units to the right of the origin on the x-axis. Its coordinates are $(3, 0)$.
Point U is located 3 units above the origin on the y-axis. Its coordinates are $(0, 3)$.
Point V is located 3 units to the right of the origin and 5 units up from the origin. Its coordinates are $(3, 5)$.
Point W is located 5 units to the right of the origin and 3 units up from the origin. Its coordinates are $(5, 3)$.
The coordinates of all the points are:
A: $(4, 0)$
B: $(0, 4)$
C: $(4, 2)$
D: $(5, 0)$
E: $(5, 5)$
F: $(0, 5)$
G: $(2, 1)$
H: $(1, 2)$
P: $(3, 3)$
Q: $(6, 3)$
R: $(5, 6)$
S: $(2, 5)$
T: $(3, 0)$
U: $(0, 3)$
V: $(3, 5)$
W: $(5, 3)$
Example 9: The following is a conversion graph of temperature in °C and °F.
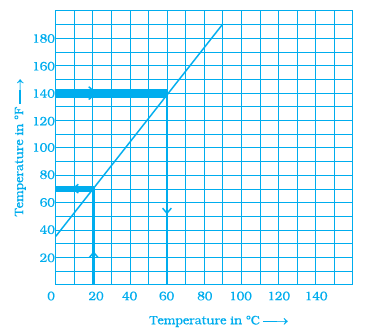
Use the graph to answer the following questions.
(a) Convert 140 °F to °C.
(b) Convert 20 °C to °F
Answer:
The given graph shows the relationship between temperature in Celsius (°C) on the x-axis and temperature in Fahrenheit (°F) on the y-axis.
We can use the graph to convert temperatures between the two scales by finding the corresponding value on the other axis for a given value on one axis.
(a) Convert 140 °F to °C.
To convert 140 °F to °C using the graph, we need to find the point on the graph where the Fahrenheit temperature (y-coordinate) is 140.
Locate the value $140$ on the y-axis (Fahrenheit scale).
Draw a horizontal line from this point on the y-axis until it intersects the temperature conversion line.
From the point of intersection on the line, draw a vertical line downwards to the x-axis (Celsius scale).
Read the value where the vertical line intersects the x-axis.
Observing the graph, a horizontal line from $140$ on the y-axis intersects the conversion line, and the vertical line from this intersection point meets the x-axis at the value $60$.
Therefore, 140 °F is equal to 60 °C.
Answer: $140^\circ$F = $60^\circ$C
(b) Convert 20 °C to °F.
To convert 20 °C to °F using the graph, we need to find the point on the graph where the Celsius temperature (x-coordinate) is 20.
Locate the value $20$ on the x-axis (Celsius scale).
Draw a vertical line upwards from this point on the x-axis until it intersects the temperature conversion line.
From the point of intersection on the line, draw a horizontal line to the left to the y-axis (Fahrenheit scale).
Read the value where the horizontal line intersects the y-axis.
Observing the graph, a vertical line from $20$ on the x-axis intersects the conversion line, and the horizontal line from this intersection point meets the y-axis at the value $68$.
Therefore, 20 °C is equal to 68 °F.
Answer: $20^\circ$C = $68^\circ$F
Example 10: Following graph shows a comparison of the approximate sale of items manufactured by a company for the first two years of its operation.
(a) In which months there was maximum difference in the sale of items of two years?
(b) In which year was there more stability in the sale of items?
(c) In which month the sale remains the same in both the years?
(d) In which month was the sales of first year less than that of second year?

Answer:
Let's analyze the given double bar graph which shows the approximate sale of items manufactured by a company for the first two years of its operation, month by month.
(a) In which months there was maximum difference in the sale of items of two years?
We need to find the absolute difference in sales between Year 1 and Year 2 for each month and then identify the month(s) where this difference is the greatest.
Difference in sales = |Sales in Year 2 - Sales in Year 1|
January: $|40 - 30| = 10$
February: $|45 - 35| = 10$
March: $|50 - 40| = 10$
April: $|60 - 45| = 15$
May: $|65 - 50| = 15$
June: $|70 - 55| = 15$
July: $|75 - 60| = 15$
August: $|75 - 60| = 15$
September: $|80 - 65| = 15$
October: $|80 - 70| = 10$
November: $|80 - 80| = 0$
December: $|85 - 85| = 0$
The maximum difference in sales is $15$. This occurred in the months of April, May, June, July, August, and September.
The months with the maximum difference in the sale of items of two years are April, May, June, July, August, and September.
(b) In which year was there more stability in the sale of items?
Stability can be judged by the variation or fluctuation in sales throughout the year. A smaller range between the minimum and maximum sales, or a smoother trend, indicates more stability.
In Year 1, the sales ranged from a minimum of $30$ (January) to a maximum of $85$ (December).
In Year 2, the sales ranged from a minimum of $40$ (January) to a maximum of $85$ (December).
The range for Year 1 is $85 - 30 = 55$.
The range for Year 2 is $85 - 40 = 45$.
A smaller range suggests less fluctuation in sales value. Year 2 has a smaller range ($45$) compared to Year 1 ($55$). Also, visually, the sales trend in Year 2 appears slightly smoother and less volatile than in Year 1.
Therefore, there was more stability in the sale of items in Year 2.
(c) In which month the sale remains the same in both the years?
We need to find the month(s) where the sales value for Year 1 is equal to the sales value for Year 2. This is represented by the points on the graph where the bars for Year 1 and Year 2 are of equal height.
Looking at the graph or the sales figures calculated in part (a):
In November, the sales in Year 1 are $80$ and in Year 2 are $80$. The sales are the same.
In December, the sales in Year 1 are $85$ and in Year 2 are $85$. The sales are the same.
The months in which the sale remains the same in both the years are November and December.
(d) In which month was the sales of first year less than that of second year?
We need to identify the month(s) where the bar for Year 1 is shorter than the bar for Year 2.
Comparing the sales figures for each month:
January: Year 1 (30) < Year 2 (40)
February: Year 1 (35) < Year 2 (45)
March: Year 1 (40) < Year 2 (50)
April: Year 1 (45) < Year 2 (60)
May: Year 1 (50) < Year 2 (65)
June: Year 1 (55) < Year 2 (70)
July: Year 1 (60) < Year 2 (75)
August: Year 1 (60) < Year 2 (75)
September: Year 1 (65) < Year 2 (80)
October: Year 1 (70) < Year 2 (80)
November: Year 1 (80) = Year 2 (80)
December: Year 1 (85) = Year 2 (85)
The sales of the first year were less than that of the second year in the months of January, February, March, April, May, June, July, August, September, and October.
The months in which the sales of first year were less than that of second year are January, February, March, April, May, June, July, August, September, and October.
Example 11: The given graphs show the progress of two different cyclists during a ride. For each graph, describe the rider’s progress over the period of time.

Answer:
The given graphs are distance-time graphs, which show how the distance of the cyclist from a starting point changes over time.
Graph 1:
This graph shows the progress of the first cyclist.
Initially, the cyclist starts from a distance of 0 at time 0.
For the first part of the journey, the graph is a straight line with a positive slope, indicating that the cyclist is moving at a constant speed and increasing their distance from the start.
Then, the graph becomes horizontal for a period, meaning the distance from the start is not changing. This indicates that the cyclist has stopped or is taking a rest.
Following the stop, the graph shows another straight line with a positive slope. The slope is different from the first segment, suggesting the cyclist is again moving at a constant but possibly different speed.
There is another horizontal segment, indicating a second stop or rest period.
Finally, the graph shows a third segment with a positive slope, where the cyclist is moving at a constant speed again.
In summary, the first cyclist rode for a while, stopped, rode again at a different pace, stopped again, and then rode once more.
Graph 2:
This graph shows the progress of the second cyclist.
The cyclist also starts from a distance of 0 at time 0.
The first segment is a steep straight line with a positive slope, indicating the cyclist is moving at a relatively high constant speed for a short time.
The second segment is also a straight line with a positive slope, but less steep than the first. This means the cyclist is still moving away from the start at a constant speed, but at a slower pace than before.
The third segment is a horizontal line, indicating that the cyclist has stopped for a period.
The fourth segment is a very steep straight line, showing that the cyclist is moving at a very high constant speed for a very short duration.
The final segment is a straight line with a shallow positive slope, indicating the cyclist is moving away from the start at a very slow constant speed for the remainder of the recorded time.
In summary, the second cyclist started fast, slowed down, stopped, briefly moved very fast, and then moved very slowly.
Example 12:
- A double bar graph is useful for the __________ of two sets of data.
- Data represented in a circular form is called a _________ chart.
- The graph of a linear equation is always a __________ line.
- The cartesian system used two axes which are __________ to each other
Answer:
- A double bar graph is useful for the comparison of two sets of data.
- Data represented in a circular form is called a pie chart.
- The graph of a linear equation is always a straight line.
- The cartesian system used two axes which are perpendicular to each other.
Example 13: Complete the given table and draw a graph for it.
| x | 0 | 1 | 2 | 3 | 4 |
| y = 2x |
Answer:
To complete the table for the equation $y = 2x$, we substitute each given value of $x$ into the equation and calculate the corresponding value of $y$.
When $x = 0$, $y = 2(0) = 0$.
When $x = 1$, $y = 2(1) = 2$.
When $x = 2$, $y = 2(2) = 4$.
When $x = 3$, $y = 2(3) = 6$.
When $x = 4$, $y = 2(4) = 8$.
The completed table is:
| x | 0 | 1 | 2 | 3 | 4 |
| y = 2x | 0 | 2 | 4 | 6 | 8 |
To draw the graph for the equation $y = 2x$ using the points from the table, follow these steps:
Step 1: Draw the coordinate axes. Draw a horizontal line and label it as the x-axis. Draw a vertical line perpendicular to the x-axis at the origin and label it as the y-axis. The intersection point is the origin $(0, 0)$.
Step 2: Choose an appropriate scale for both axes. Since the x-values range from 0 to 4 and y-values range from 0 to 8, you can choose 1 unit on both axes to represent a certain value, or a different scale if needed (e.g., 1 unit on y-axis representing 2 units). Label the axes with the chosen scale.
Step 3: Plot the points from the completed table on the graph paper. The points are $(x, y)$: $(0, 0)$, $(1, 2)$, $(2, 4)$, $(3, 6)$, and $(4, 8)$.
To plot a point $(x, y)$, start from the origin, move $x$ units along the x-axis (right for positive $x$, left for negative $x$), and then move $y$ units parallel to the y-axis (up for positive $y$, down for negative $y$).
Plot (0, 0) at the origin.
Plot (1, 2) by moving 1 unit right from the origin and then 2 units up.
Plot (2, 4) by moving 2 units right from the origin and then 4 units up.
Plot (3, 6) by moving 3 units right from the origin and then 6 units up.
Plot (4, 8) by moving 4 units right from the origin and then 8 units up.
Step 4: Connect the plotted points. Since the equation $y = 2x$ is a linear equation, the points should lie on a straight line. Use a ruler to draw a straight line passing through all the plotted points. Extend the line beyond the points and put arrows on both ends to indicate that the graph continues indefinitely.
The graph obtained is a straight line passing through the origin, which is the graph of the equation $y = 2x$.
Exercise
Question 1 to 10 (Multiple Choice Questions)
In questions 1 to 10, there are four options out of which one is correct. Write the correct answer.
Question 1. Comparison of parts of a whole may be done by a
(a) bar graph
(b) pie chart
(c) linear graph
(d) line graph
Answer:
Let's examine the uses of each type of graph listed:
(a) A bar graph is used to compare discrete categories or values.
(b) A pie chart represents a whole circle divided into sectors, where each sector's size is proportional to the part of the whole it represents. This is ideal for comparing parts of a whole.
(c) A linear graph (or line graph) shows the relationship between two variables, often used to display data that changes over time or a continuous range.
(d) A line graph is typically used to show trends or changes in data over a continuous period or variable.
The question asks for a graph used for the "comparison of parts of a whole". A pie chart is specifically designed for this purpose.
Therefore, the correct answer is (b) pie chart.
Question 2. A graph that displays data that changes continuously over periods of time is
(a) bar graph
(b) pie chart
(c) histogram
(d) line graph
Answer:
Let's consider the purpose of each type of graph provided in the options:
(a) A bar graph is used to compare quantities among different categories. It is not suitable for showing continuous change over time.
(b) A pie chart is used to represent parts of a whole. It does not show how data changes over time.
(c) A histogram is used to display the frequency distribution of continuous data. It shows how often data falls into specific ranges or intervals, but it doesn't typically show changes over a continuous time period for a single variable.
(d) A line graph consists of points plotted on a coordinate plane and connected by line segments. It is commonly used to display data that changes continuously over time, showing trends, increases, decreases, etc.
Therefore, the graph that displays data that changes continuously over periods of time is a line graph.
The correct answer is (d) line graph.
Question 3. In the given graph the coordinates of point x are
(a) (0, 2)
(b) (2, 3)
(c) (3, 2)
(d) (3, 0)
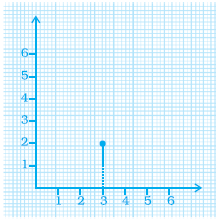
Answer:
In a Cartesian coordinate system, the coordinates of a point are given by an ordered pair $(x, y)$, where $x$ is the value on the x-axis (horizontal axis) and $y$ is the value on the y-axis (vertical axis) corresponding to the point's location.
To find the coordinates of point X on the given graph, we locate point X and then determine its position relative to the origin $(0, 0)$.
First, we find the x-coordinate by drawing a vertical line from point X down to the x-axis. The point where this line intersects the x-axis gives the x-coordinate.
On the given graph, drawing a vertical line from point X to the x-axis, we see that it intersects the x-axis at the value $3$. So, the x-coordinate of X is $3$.
Next, we find the y-coordinate by drawing a horizontal line from point X to the y-axis. The point where this line intersects the y-axis gives the y-coordinate.
On the given graph, drawing a horizontal line from point X to the y-axis, we see that it intersects the y-axis at the value $2$. So, the y-coordinate of X is $2$.
Therefore, the coordinates of point X are $(3, 2)$.
Comparing this with the given options:
(a) $(0, 2)$: This point is on the y-axis, 2 units above the origin.
(b) $(2, 3)$: This point would be 2 units right and 3 units up from the origin.
(c) $(3, 2)$: This point is 3 units right and 2 units up from the origin, which matches the location of point X.
(d) $(3, 0)$: This point is on the x-axis, 3 units to the right of the origin.
The coordinates of point X are indeed $(3, 2)$.
The correct answer is (c) (3, 2).
Question 4. In the given graph the letter that indicates the point (0, 3) is
(a) P
(b) Q
(c) R
(d) S

Answer:
The coordinates of a point are given in the form $(x, y)$, where $x$ is the x-coordinate (horizontal position) and $y$ is the y-coordinate (vertical position) relative to the origin $(0, 0)$.
We are looking for the point with coordinates $(0, 3)$.
For the point $(0, 3)$:
The x-coordinate is $0$. This means the point is located on the y-axis.
The y-coordinate is $3$. This means the point is located $3$ units above the origin along the y-axis.
Now let's look at the points labeled on the graph:
Point P: Located at 3 units right on the x-axis and 3 units up on the y-axis. Coordinates are $(3, 3)$.
Point Q: Located on the y-axis (x-coordinate is 0) at a height of 3 units above the origin. Coordinates are $(0, 3)$.
Point R: Located on the x-axis (y-coordinate is 0) at a distance of 3 units to the right of the origin. Coordinates are $(3, 0)$.
Point S: Located at the intersection of the x and y axes (the origin). Coordinates are $(0, 0)$.
The point with coordinates $(0, 3)$ is Point Q.
The correct answer is (b) Q.
Question 5. The point (3, 4) is at a distance of
(a) 3 from both the axis
(b) 4 from both the axis
(c) 4 from the x axis and 3 from y axis
(d) 3 from x axis and from y axis
Answer:
In a Cartesian coordinate system, the coordinates of a point are given as an ordered pair $(x, y)$.
The x-coordinate ($x$) represents the horizontal distance of the point from the y-axis.
The y-coordinate ($y$) represents the vertical distance of the point from the x-axis.
For the given point $(3, 4)$:
The x-coordinate is $3$. This means the point is $3$ units away from the y-axis.
The y-coordinate is $4$. This means the point is $4$ units away from the x-axis.
Therefore, the point $(3, 4)$ is at a distance of $4$ from the x-axis and $3$ from the y-axis.
Let's check the options:
(a) 3 from both the axis - Incorrect.
(b) 4 from both the axis - Incorrect.
(c) 4 from the x axis and 3 from y axis - Correct.
(d) 3 from x axis and from y axis - This option is poorly phrased, but based on standard coordinate definitions, the distance from the x-axis is the y-coordinate, and the distance from the y-axis is the x-coordinate. So, the distance from the x-axis is 4, and the distance from the y-axis is 3.
The correct statement is that the point is 4 units away from the x-axis and 3 units away from the y-axis.
The correct answer is (c) 4 from the x axis and 3 from y axis.
Question 6. A point which lies on both the axis is __________
(a) (0, 0)
(b) (0, 1)
(c) (1, 0)
(d) (1, 1)
Answer:
In a Cartesian coordinate system, the x-axis and the y-axis are two perpendicular lines that intersect at a single point.
Any point on the x-axis has a y-coordinate of $0$. Its coordinates are of the form $(x, 0)$.
Any point on the y-axis has an x-coordinate of $0$. Its coordinates are of the form $(0, y)$.
A point that lies on both the x-axis and the y-axis must satisfy both conditions simultaneously. That is, its x-coordinate must be $0$ and its y-coordinate must also be $0$.
The point with coordinates $(0, 0)$ is the unique point that satisfies both conditions.
This point is called the origin.
Let's look at the options:
(a) $(0, 0)$: The x-coordinate is 0, so it's on the y-axis. The y-coordinate is 0, so it's on the x-axis. This point lies on both axes.
(b) $(0, 1)$: The x-coordinate is 0, so it's on the y-axis. The y-coordinate is 1 (not 0), so it is not on the x-axis.
(c) $(1, 0)$: The x-coordinate is 1 (not 0), so it is not on the y-axis. The y-coordinate is 0, so it's on the x-axis.
(d) $(1, 1)$: The x-coordinate is 1 (not 0) and the y-coordinate is 1 (not 0). This point is not on either axis (unless it is the origin, which it is not).
Therefore, the point which lies on both the axis is $(0, 0)$.
The correct answer is (a) (0, 0).
Question 7. The coordinates of a point at a distance of 3 units from the x axis and 6 units from the y axis is
(a) (0, 3)
(b) (6, 0)
(c) (3, 6)
(d) (6, 3)
Answer:
In a Cartesian coordinate system, for a point with coordinates $(x, y)$:
The absolute value of the y-coordinate, $|y|$, represents the distance of the point from the x-axis.
The absolute value of the x-coordinate, $|x|$, represents the distance of the point from the y-axis.
We are given that the distance from the x-axis is 3 units. This means $|y| = 3$. So, the y-coordinate is either $3$ or $-3$.
We are given that the distance from the y-axis is 6 units. This means $|x| = 6$. So, the x-coordinate is either $6$ or $-6$.
The coordinates of the point could be $(6, 3)$, $(6, -3)$, $(-6, 3)$, or $(-6, -3)$, depending on the quadrant the point is in. The question does not specify the quadrant, but the options provide specific pairs.
Let's check the given options:
(a) $(0, 3)$: Distance from x-axis is $|3| = 3$. Distance from y-axis is $|0| = 0$. Incorrect.
(b) $(6, 0)$: Distance from x-axis is $|0| = 0$. Distance from y-axis is $|6| = 6$. Incorrect.
(c) $(3, 6)$: Distance from x-axis is $|6| = 6$. Distance from y-axis is $|3| = 3$. Incorrect (distances are swapped).
(d) $(6, 3)$: Distance from x-axis is $|3| = 3$. Distance from y-axis is $|6| = 6$. Correct.
The only option that satisfies both conditions (distance 3 from x-axis and 6 from y-axis) is $(6, 3)$.
The correct answer is (d) (6, 3).
Question 8. In the given figure the position of the book on the table may be given by

(a) (7, 3)
(b) (3, 7)
(c) (3, 3)
(d) (7, 7)
Answer:
In a coordinate system, the position of a point is described by an ordered pair $(x, y)$, where the first value ($x$) represents the horizontal position and the second value ($y$) represents the vertical position.
In the given figure, the "Left Edge" serves as a reference for the horizontal position (analogous to the x-axis), and the "Bottom Edge" serves as a reference for the vertical position (analogous to the y-axis).
We need to determine the coordinates of the book based on the scales provided along the left and bottom edges.
By observing the figure, the book is positioned such that its horizontal alignment corresponds to the mark labeled '3' on the scale starting from the "Left Edge". This indicates the x-coordinate is $3$.
The book's vertical alignment corresponds to the mark labeled '7' on the scale starting from the "Bottom Edge". This indicates the y-coordinate is $7$.
Therefore, the position of the book on the table is given by the coordinates $(3, 7)$.
Let's check the given options:
(a) $(7, 3)$: This would mean 7 units horizontally and 3 units vertically. This does not match the figure.
(b) $(3, 7)$: This means 3 units horizontally and 7 units vertically. This matches the position of the book in the figure.
(c) $(3, 3)$: This would mean 3 units horizontally and 3 units vertically. This does not match the figure.
(d) $(7, 7)$: This would mean 7 units horizontally and 7 units vertically. This does not match the figure.
The coordinates representing the position of the book are $(3, 7)$.
The correct answer is (b) (3, 7).
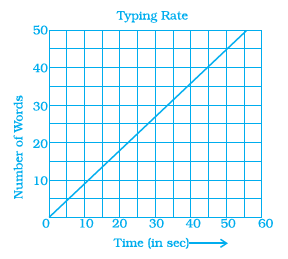
Question 9. Data was collected on a student’s typing rate and graph was drawn as shown below. Approximately how many words had this student typed in 30 seconds?
(a) 20
(b) 24
(c) 28
(d) 34
Answer:
To find the approximate number of words typed in 30 seconds, we look at the given graph.
Find $30$ on the horizontal axis (Time in seconds).
Move vertically up from $30$ until you reach the graph line.
Then, move horizontally from that point on the graph to the left, towards the vertical axis (Number of Words Typed).
Observe the value on the vertical axis where the horizontal line meets it.
Based on the graph, the line intersects the y-axis approximately at $24$ when the time is $30$ seconds.
Therefore, the student typed approximately 24 words in 30 seconds.
The correct answer is (b) 24.
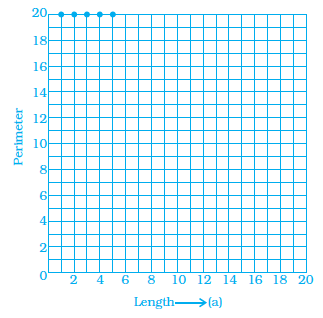
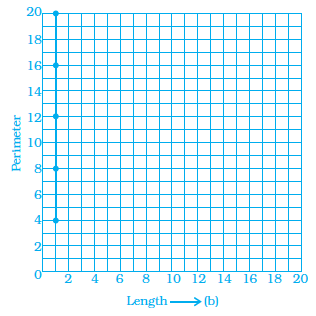
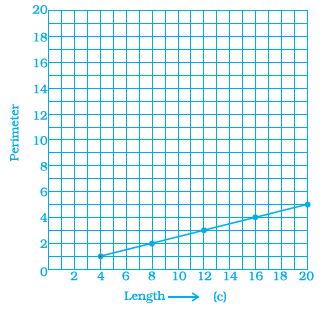
Question 10. Which graphs of the following represent the table below?
| Length of Side of a Square | 1 | 2 | 3 | 4 | 5 |
|---|---|---|---|---|---|
| Perimeter | 4 | 8 | 12 | 16 | 20 |
(a)
(b)
(c)
(d)

Answer:
The given table shows the relationship between the length of the side of a square and its perimeter. Let the length of the side be $s$ and the perimeter be $P$. The values from the table are:
When $s = 1$, $P = 4$. This gives the point $(1, 4)$.
When $s = 2$, $P = 8$. This gives the point $(2, 8)$.
When $s = 3$, $P = 12$. This gives the point $(3, 12)$.
When $s = 4$, $P = 16$. This gives the point $(4, 16)$.
When $s = 5$, $P = 20$. This gives the point $(5, 20)$.
The formula for the perimeter of a square with side length $s$ is $P = 4s$. This is a linear relationship between the side length and the perimeter.
We need to find which graph represents these points.
Let's examine each graph:
Graph (a): This is a line graph. The x-axis represents the Length of Side, and the y-axis represents the Perimeter. Let's check if the points from the table lie on this line.
At x=1, y=4. (Correct)
At x=2, y=8. (Correct)
At x=3, y=12. (Correct)
At x=4, y=16. (Correct)
At x=5, y=20. (Correct)
The graph also appears to pass through the origin (0, 0), which is consistent with the formula $P=4s$ (when $s=0$, $P=0$). The points are plotted and connected by a straight line, which is appropriate for a linear relationship.
Graph (b): This is a bar graph. The x-axis represents the Length of Side, and the height of each bar represents the Perimeter for that side length. Let's check the bar heights.
For Length 1, the bar height is 4. (Correct)
For Length 2, the bar height is 8. (Correct)
For Length 3, the bar height is 12. (Correct)
For Length 4, the bar height is 16. (Correct)
For Length 5, the bar height is 20. (Correct)
This bar graph correctly represents the discrete data points from the table.
Graph (c): This is also a bar graph, similar to graph (b). Let's check the bar heights.
For Length 1, the bar height is 4. (Correct)
For Length 2, the bar height is 8. (Correct)
For Length 3, the bar height is 12. (Correct)
For Length 4, the bar height is 16. (Correct)
For Length 5, the bar height is 20. (Correct)
This bar graph also correctly represents the discrete data points from the table.
Graph (d): This is a line graph. The x-axis represents the Length of Side, and the y-axis represents the Perimeter. Let's check the points plotted.
At x=1, y=1. (Incorrect, should be 4)
At x=2, y=2. (Incorrect, should be 8)
This graph represents the relationship $P=s$, which is not the perimeter of a square.
Both bar graphs (b) and (c) correctly represent the given data points from the table. Graph (a), a line graph, also correctly plots the given data points and shows the linear relationship $P=4s$.
However, in the context of representing a functional relationship between two variables, especially a linear one, a line graph is typically considered a more appropriate visual representation than a bar graph, as it emphasizes the continuous nature of the relationship (although the table only provides discrete points).
Given the options, and assuming the question intends to show the graph of the linear function represented by the table, the line graph (a) is the most suitable answer as it not only plots the points correctly but also represents the underlying linear relationship.
Therefore, the graph that best represents the table is graph (a).
The correct answer is (a).
Question 11 to 25 (Fill in the Blanks)
In questions 11 to 25, fill in the blanks to make the statements true.
Question 11. __________ displays data that changes continuously over periods of time.
Answer:
The blank should be filled with Line graph.
A line graph is a type of chart used to visualize data that changes over a continuous period of time. It consists of data points plotted on a Cartesian plane, where the x-axis typically represents time (such as days, months, or years), and the y-axis represents the data value being measured (such as temperature, sales, or stock prices).
The data points are connected by line segments. These line segments show the trend and rate of change of the data between the plotted points, illustrating how the variable progresses smoothly (or changes continuously) over the specified time interval. This makes line graphs particularly suitable for showing trends, progress, or fluctuations of a variable over time.
Question 12. The relation between dependent and independent variables is shown through a __________.
Answer:
The blank should be filled with Graph.
In mathematical and scientific contexts, we often analyze how one quantity changes in relation to another. These quantities are referred to as variables. The independent variable is the one whose values are chosen or manipulated (often plotted on the x-axis), and the dependent variable is the one whose values are observed or measured and that changes in response to the independent variable (often plotted on the y-axis).
A graph is a powerful visual representation tool used to display the relationship between dependent and independent variables. By plotting pairs of corresponding values as points on a coordinate system and connecting them (if appropriate), the graph shows how the dependent variable changes as the independent variable varies. This visual depiction helps in understanding the nature of the relationship, identifying trends, and making predictions.
Question 13. We need __________ coordinates for representing a point on the graph sheet.
Answer:
The blank should be filled with two.
A standard graph sheet represents a two-dimensional plane, typically known as the Cartesian plane. To locate any single point uniquely on this plane, we need two pieces of information, or coordinates.
These two coordinates are the x-coordinate (or abscissa) and the y-coordinate (or ordinate). The x-coordinate tells us the point's horizontal distance and direction from the y-axis, and the y-coordinate tells us the point's vertical distance and direction from the x-axis. Together, the pair of coordinates $(x, y)$ precisely defines the position of a point on the graph sheet.
Question 14. A point in which the x-coordinate is zero and y-coordinate is non_x0002_zero will lie on the _________
Answer:
The blank should be filled with y-axis.
In the Cartesian coordinate system, the x-coordinate (abscissa) of a point represents its horizontal position relative to the origin, and the y-coordinate (ordinate) represents its vertical position.
The y-axis is defined as the vertical line where the x-coordinate of every point is 0. So, any point with coordinates $(0, y)$ lies on the y-axis. Since the y-coordinate is given as non-zero, the point is not the origin $(0,0)$, but it still lies somewhere on the y-axis (either above or below the x-axis depending on the sign of the y-coordinate).
Question 15. The horizontal and vertical line in a line graph are usually called __________ and __________.
Answer:
The blanks should be filled with x-axis and y-axis.
In a standard line graph, which uses a Cartesian coordinate system to plot data points, the horizontal line is conventionally referred to as the x-axis. This axis typically represents the independent variable, such as time.
The vertical line is referred to as the y-axis. This axis typically represents the dependent variable, such as the quantity or value being measured and displayed as it changes over time or the independent variable.
Question 16. The process of fixing a point with the help of the coordinates is known as __________ of the point.
Answer:
The blank should be filled with plotting.
In a coordinate system, such as the Cartesian plane, a point's location is uniquely identified by a pair of coordinates, usually $(x, y)$. The x-coordinate indicates the position along the horizontal axis, and the y-coordinate indicates the position along the vertical axis.
The action of using these given coordinates to mark or draw the exact position of that point on a graph sheet is called plotting the point. It's the visual representation of an ordered pair of numbers as a specific location on the plane.
Question 17. The distance of any point from the y-axis is the __________ coordinate.
Answer:
The blank should be filled with x-.
In a two-dimensional Cartesian coordinate system, a point is represented by an ordered pair $(x, y)$.
The x-coordinate (or abscissa) of a point indicates its perpendicular distance from the y-axis. If the x-coordinate is positive, the point is to the right of the y-axis; if it's negative, it's to the left. The absolute value of the x-coordinate, $|x|$, represents the actual distance from the y-axis.
Similarly, the y-coordinate (or ordinate) indicates the perpendicular distance from the x-axis. The absolute value of the y-coordinate, $|y|$, represents the actual distance from the x-axis.
Therefore, the distance of any point from the y-axis is given by its x-coordinate (specifically, the absolute value of the x-coordinate, but the question asks for the name of the coordinate itself).
Question 18. All points with y-coordinate as zero lie on the __________.
Answer:
The blank should be filled with x-axis.
In the Cartesian coordinate system, a point is located by its coordinates $(x, y)$. The y-coordinate represents the perpendicular distance of the point from the x-axis.
If the y-coordinate of a point is $0$, it means the point has zero vertical distance from the x-axis. This means the point must lie directly on the x-axis itself. The x-axis is defined as the locus of all points where the y-coordinate is $0$.
For example, the points $(5, 0)$, $(-3, 0)$, and $(0, 0)$ all lie on the x-axis because their y-coordinates are $0$.
Question 19. For the point (5, 2), the distance from the x -axis is __________ units.
Answer:
The blank should be filled with 2.
In a Cartesian coordinate system, a point is represented by an ordered pair $(x, y)$, where $x$ is the x-coordinate and $y$ is the y-coordinate.
The distance of a point from the x-axis is given by the absolute value of its y-coordinate, $|y|$. The distance from the y-axis is given by the absolute value of its x-coordinate, $|x|$.
For the given point $(5, 2)$, the x-coordinate is $5$ and the y-coordinate is $2$.
The distance from the x-axis is the absolute value of the y-coordinate, which is $|2| = 2$.
The distance from the y-axis is the absolute value of the x-coordinate, which is $|5| = 5$.
Therefore, the distance of the point $(5, 2)$ from the x-axis is $2$ units.
Question 20. The x-coordinate of any point lying on the y-axis will be __________.
Answer:
The blank should be filled with zero.
In the two-dimensional Cartesian coordinate system, points are located using an ordered pair of numbers $(x, y)$. The first number, $x$, is the x-coordinate, and the second number, $y$, is the y-coordinate.
The x-coordinate represents the horizontal distance of a point from the y-axis. The y-axis itself is the vertical line that passes through the origin $(0, 0)$.
By definition, every point that lies on the y-axis has a horizontal distance of $0$ from the y-axis. Therefore, the x-coordinate of any point on the y-axis is always $0$. Points on the y-axis have the general form $(0, y)$.
Question 21. The y-coordinate of the point (2, 4) is __________.
Answer:
The blank should be filled with 4.
In a two-dimensional Cartesian coordinate system, a point is represented by an ordered pair of numbers $(x, y)$. The first number in the pair, $x$, is the x-coordinate (or abscissa), and the second number, $y$, is the y-coordinate (or ordinate).
For the given point $(2, 4)$, the first number is $2$, which is the x-coordinate, and the second number is $4$, which is the y-coordinate.
Question 22. In the point (4, 7), 4 denotes the __________.
Answer:
The blank should be filled with x-coordinate.
In an ordered pair representing a point in the Cartesian coordinate system, the numbers are written in the form $(x, y)$. The first number, $x$, is always the x-coordinate (also called the abscissa), and it represents the horizontal position or distance from the y-axis.
The second number, $y$, is the y-coordinate (also called the ordinate), representing the vertical position or distance from the x-axis.
For the given point $(4, 7)$, the first number is $4$. Therefore, $4$ denotes the x-coordinate of the point.
Question 23. A point has 5 as its x –coordinate and 4 as its y–coordinate. Then the coordinates of the point are given by __________.
Answer:
The blank should be filled with (5, 4).
In the Cartesian coordinate system, the location of a point is specified by an ordered pair of numbers, written as $(x, y)$. The first number in the pair is the x-coordinate (or abscissa), which indicates the horizontal position, and the second number is the y-coordinate (or ordinate), which indicates the vertical position.
Given that the x-coordinate is $5$ and the y-coordinate is $4$, we simply arrange these values in the standard ordered pair format $(x, y)$.
So, the coordinates of the point are $(5, 4)$.
Question 24. In the coordinates of a point, the second number denotes the __________.
Answer:
The blank should be filled with y-coordinate.
In a two-dimensional Cartesian coordinate system, a point is represented by an ordered pair of numbers in the format $(x, y)$.
The first number in the ordered pair, $x$, is the x-coordinate (or abscissa). It represents the horizontal position of the point relative to the origin.
The second number in the ordered pair, $y$, is the y-coordinate (or ordinate). It represents the vertical position of the point relative to the origin.
Therefore, the second number in the coordinates of a point $(x, y)$ always denotes the y-coordinate.
Question 25. The point where the two axes intersect is called the __________.
Answer:
The blank should be filled with origin.
In a Cartesian coordinate system, the horizontal axis is called the x-axis, and the vertical axis is called the y-axis. These two axes are perpendicular to each other.
The point where these two axes cross or intersect is a unique point from which all other points on the plane are referenced. This point is called the origin.
The coordinates of the origin are always $(0, 0)$, as it represents zero distance along both the x-axis and the y-axis from the intersection point itself.
Question 26 to 34 (True or False)
In the questions 26 to 34, state whether the statements are true (T) or false (F).
Question 26. For fixing a point on the graph sheet we need two coordinates.
Answer:
True (T)
A standard graph sheet represents a two-dimensional plane, commonly known as the Cartesian plane.
To uniquely identify the position of any point on this plane, we require two pieces of information: its horizontal position and its vertical position relative to a fixed origin.
These two pieces of information are precisely the x-coordinate (which specifies the horizontal location) and the y-coordinate (which specifies the vertical location). Together, the ordered pair $(x, y)$ provides the exact coordinates needed to fix a point on the graph sheet.
Question 27. A line graph can also be a whole unbroken line.
Answer:
True (T)
A line graph is used to display data that changes over time or another continuous variable. It consists of plotting data points and connecting them with line segments.
If the data being represented is continuous (meaning it can take any value within a range, like temperature, time, distance, etc.) and the graph shows the relationship between these continuous variables, the resulting graph is a continuous curve or line without breaks. In such cases, the line segments connect smoothly, forming a "whole unbroken line". This is common when graphing functions or natural phenomena that change smoothly over time.
Question 28. The distance of any point from the x -axis is called the x-coordinate.
Answer:
False (F)
In the Cartesian coordinate system, a point is represented by an ordered pair $(x, y)$.
The x-coordinate ($x$) represents the perpendicular distance of the point from the y-axis. Its absolute value, $|x|$, is the actual distance.
The y-coordinate ($y$) represents the perpendicular distance of the point from the x-axis. Its absolute value, $|y|$, is the actual distance.
Therefore, the distance of any point from the x-axis is given by its y-coordinate (specifically, the absolute value of the y-coordinate), not the x-coordinate.
Question 29. The distance of the point (3, 5) from the y-axis is 5.
Answer:
False (F)
In a Cartesian coordinate system, a point is represented by an ordered pair $(x, y)$.
The distance of a point from the y-axis is given by the absolute value of its x-coordinate. For a point $(x, y)$, the distance from the y-axis is $|x|$.
The distance of a point from the x-axis is given by the absolute value of its y-coordinate. For a point $(x, y)$, the distance from the x-axis is $|y|$.
For the given point $(3, 5)$:
The x-coordinate is $3$.
The y-coordinate is $5$.
The distance from the y-axis is $|3| = 3$ units.
The distance from the x-axis is $|5| = 5$ units.
The statement claims the distance from the y-axis is 5, which is incorrect. The distance from the y-axis is 3.
Question 30. The ordinate of a point is its distance from the y-axis.
Answer:
False (F)
In a Cartesian coordinate system, a point is represented by an ordered pair $(x, y)$.
The ordinate of a point is its y-coordinate, which is the second number in the ordered pair, $y$.
The distance of a point from the y-axis is given by the absolute value of its x-coordinate. This x-coordinate is also known as the abscissa. The distance is $|x|$.
Therefore, the ordinate (y-coordinate) represents the distance from the x-axis, not the y-axis. The statement is incorrect.
Question 31. In the point (2, 3), 3 denotes the y-coordinate.
Answer:
True (T)
In the Cartesian coordinate system, the position of a point in a two-dimensional plane is uniquely identified by an ordered pair of numbers, written as $(x, y)$.
In this ordered pair:
The first number, $x$, is the x-coordinate (or abscissa). It represents the horizontal position of the point relative to the origin.
The second number, $y$, is the y-coordinate (or ordinate). It represents the vertical position of the point relative to the origin.
For the given point $(2, 3)$, the first number is $2$ and the second number is $3$. Therefore, $2$ is the x-coordinate and $3$ is the y-coordinate. The statement is correct.
Question 32. The coordinates of the origin are (0, 0).
Answer:
True (T)
In a Cartesian coordinate system, the origin is the point where the x-axis and the y-axis intersect.
By definition, the origin is the reference point from which all other points on the plane are located. Its position corresponds to a horizontal displacement of zero units from the y-axis (meaning its x-coordinate is 0) and a vertical displacement of zero units from the x-axis (meaning its y-coordinate is 0).
Thus, the coordinates of the origin are always $(0, 0)$.
Question 33. The points (3, 5) and (5, 3) represent the same point.
Answer:
False (F)
In a Cartesian coordinate system, a point is represented by an ordered pair of numbers $(x, y)$. The order of the numbers is crucial because the first number always represents the x-coordinate (horizontal position), and the second number always represents the y-coordinate (vertical position).
For the point $(3, 5)$:
x-coordinate $= 3$
y-coordinate $= 5$
This point is located 3 units to the right (or left, depending on axis orientation) of the origin along the x-axis and 5 units up (or down) from the origin along the y-axis.
For the point $(5, 3)$:
x-coordinate $= 5$
y-coordinate $= 3$
This point is located 5 units along the x-axis and 3 units along the y-axis.
Since the ordered pairs are different, the points they represent are located at different positions on the graph sheet, unless both coordinates are identical (e.g., $(3, 3)$ and $(3, 3)$).
Question 34. The y-coordinate of any point lying on the x -axis will be zero.
Answer:
True (T)
In the two-dimensional Cartesian coordinate system, the x-axis is the horizontal line. Points on this line have a specific characteristic regarding their coordinates.
The y-coordinate of a point represents its perpendicular distance from the x-axis. If a point lies directly on the x-axis, its vertical distance from the x-axis is $0$.
Therefore, any point located on the x-axis will always have a y-coordinate equal to zero. Points on the x-axis have the general form $(x, 0)$, where $x$ can be any real number.
Question 35 to 36 (Match the Following)
Question 35. Match the coordinates given in Column A with the items mentioned in Column B.
Column A
(1) (0, 5)
(2) (2, 3)
(3) (4, 8)
(4) (3, 7)
(5) (0, 0)
(6) (5, 0)
Column B
(a) y coordinate is 2 × x - coordinate + 1.
(b) Coordinates of origin.
(c) Only y–coordinate is zero.
(d) The distance from x –axis is 5.
(e) y coordinate is double of x –coordinate.
(f) The distance from y–axis is 2.
Answer:
Matching the coordinates from Column A with the descriptions in Column B:
(1) (0, 5) matches with (d) The distance from x –axis is 5.
For the point (0, 5), the y-coordinate is 5. The distance from the x-axis is given by the absolute value of the y-coordinate, which is $|5| = 5$.
(2) (2, 3) matches with (f) The distance from y–axis is 2.
For the point (2, 3), the x-coordinate is 2. The distance from the y-axis is given by the absolute value of the x-coordinate, which is $|2| = 2$.
(3) (4, 8) matches with (e) y coordinate is double of x –coordinate.
For the point (4, 8), the x-coordinate is 4 and the y-coordinate is 8. We check if the y-coordinate is double the x-coordinate: $8 = 2 \times 4$, which is true.
(4) (3, 7) matches with (a) y coordinate is 2 × x - coordinate + 1.
For the point (3, 7), the x-coordinate is 3 and the y-coordinate is 7. We check the given relation $y = 2x + 1$: $7 = 2(3) + 1 \implies 7 = 6 + 1 \implies 7 = 7$. This is true.
(5) (0, 0) matches with (b) Coordinates of origin.
The point (0, 0) is the standard representation for the origin in the Cartesian coordinate system, where the two axes intersect.
(6) (5, 0) matches with (c) Only y–coordinate is zero.
For the point (5, 0), the y-coordinate is 0, while the x-coordinate is 5, which is non-zero. Points with a zero y-coordinate lie on the x-axis. Since the x-coordinate is non-zero, it is a point on the x-axis other than the origin.
The matches are:
(1) - (d)
(2) - (f)
(3) - (e)
(4) - (a)
(5) - (b)
(6) - (c)
Question 36. Match the ordinates of the points given in Column A with the items mentioned in Column B.
Column A
(a) (7, 0)
(b) (11, 11)
(c) (4, 8)
(d) (6, 2)
(e) (0, 9)
(f) (6, 3)
Column B
(i) The ordinate is double the abscissa.
(ii) The ordinate is zero.
(iii) The ordinate is equal to the abscissa.
(iv) The abscissa is double the ordinate.
(v) The abscissa is triple the ordinate.
(vi) The abscissa is zero.
Answer:
Matching the ordinates/abscissas from Column A with the descriptions in Column B:
Recall that for a point $(x, y)$, $x$ is the abscissa and $y$ is the ordinate.
(a) (7, 0): Here $x=7$, $y=0$. The ordinate is zero. This matches description (ii) The ordinate is zero.
(b) (11, 11): Here $x=11$, $y=11$. The ordinate is equal to the abscissa ($y=x$). This matches description (iii) The ordinate is equal to the abscissa.
(c) (4, 8): Here $x=4$, $y=8$. We check if $y=2x$: $8 = 2 \times 4$, which is true. The ordinate is double the abscissa. This matches description (i) The ordinate is double the abscissa.
(d) (6, 2): Here $x=6$, $y=2$. We check if $x=3y$: $6 = 3 \times 2$, which is true. The abscissa is triple the ordinate. This matches description (v) The abscissa is triple the ordinate.
(e) (0, 9): Here $x=0$, $y=9$. The abscissa is zero. This matches description (vi) The abscissa is zero.
(f) (6, 3): Here $x=6$, $y=3$. We check if $x=2y$: $6 = 2 \times 3$, which is true. The abscissa is double the ordinate. This matches description (iv) The abscissa is double the ordinate.
The correct matches are:
(a) - (ii)
(b) - (iii)
(c) - (i)
(d) - (v)
(e) - (vi)
(f) - (iv)
Question 37 to 86
Question 37. From the given graph, choose the letters that indicate the location of the points given below.
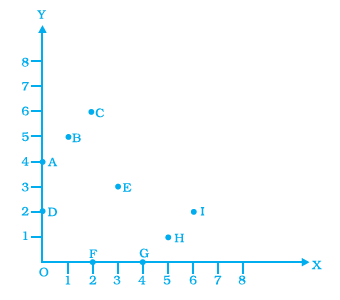
(a) (2, 0)
(b) (0, 4)
(c) (5, 1)
(d) (2, 6)
(e) (3,3)
Answer:
We need to identify the point on the graph that corresponds to each set of coordinates provided.
Let's determine the coordinates of the points labelled with letters on the graph:
- Point P is located on the x-axis at $x=2$. Its coordinates are $(2, 0)$.
- Point Q is located on the y-axis at $y=4$. Its coordinates are $(0, 4)$.
- Point R is located where the x-coordinate is $5$ and the y-coordinate is $1$. Its coordinates are $(5, 1)$.
- Point S is located where the x-coordinate is $2$ and the y-coordinate is $6$. Its coordinates are $(2, 6)$.
- Point H is located where the x-coordinate is $3$ and the y-coordinate is $3$. Its coordinates are $(3, 3)$.
Now, we match the given coordinates with the points on the graph:
(a) The coordinates are $(2, 0)$. This matches the location of point P.
(b) The coordinates are $(0, 4)$. This matches the location of point Q.
(c) The coordinates are $(5, 1)$. This matches the location of point R.
(d) The coordinates are $(2, 6)$. This matches the location of point S.
(e) The coordinates are $(3, 3)$. This matches the location of point H.
Final Answer:
(a) (2, 0) - P
(b) (0, 4) - Q
(c) (5, 1) - R
(d) (2, 6) - S
(e) (3, 3) - H
Question 38. Find the coordinates of all letters in the graph given below.
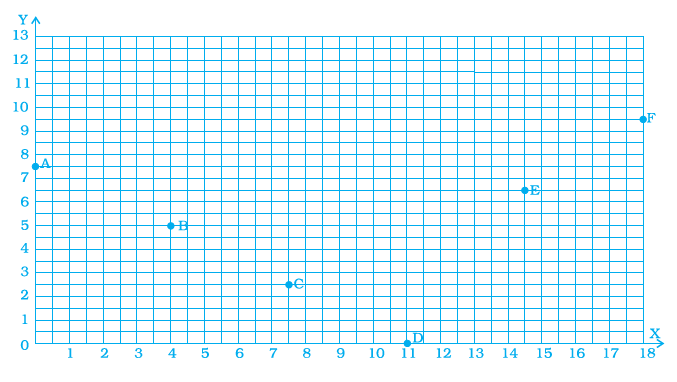
Answer:
To find the coordinates of each point, we need to determine its position relative to the x-axis (horizontal) and the y-axis (vertical). The coordinates are written as an ordered pair $(x, y)$, where $x$ is the value on the x-axis and $y$ is the value on the y-axis.
Let's find the coordinates for each labelled point:
Point A: Go down from A to the x-axis. The value is $4$. Go across from A to the y-axis. The value is $5$. The coordinates of A are (4, 5).
Point B: Go down from B to the x-axis. The value is $1$. Go across from B to the y-axis. The value is $4$. The coordinates of B are (1, 4).
Point C: Go down from C to the x-axis. The value is $7$. Go across from C to the y-axis. The value is $7$. The coordinates of C are (7, 7).
Point D: Point D lies on the x-axis. Go down from D to the x-axis. The value is $8$. Go across from D to the y-axis. The value is $0$. The coordinates of D are (8, 0).
Point E: Point E lies on the x-axis. Go down from E to the x-axis. The value is $4$. Go across from E to the y-axis. The value is $0$. The coordinates of E are (4, 0).
Point F: Go down from F to the x-axis. The value is $5$. Go across from F to the y-axis. The value is $2$. The coordinates of F are (5, 2).
Point G: Go down from G to the x-axis. The value is $4$. Go across from G to the y-axis. The value is $6$. The coordinates of G are (4, 6).
Point H: Point H lies on the y-axis. Go down from H to the x-axis. The value is $0$. Go across from H to the y-axis. The value is $6$. The coordinates of H are (0, 6).
Point I: Point I lies on the y-axis. Go down from I to the x-axis. The value is $0$. Go across from I to the y-axis. The value is $8$. The coordinates of I are (0, 8).
Summary of coordinates:
A: (4, 5)
B: (1, 4)
C: (7, 7)
D: (8, 0)
E: (4, 0)
F: (5, 2)
G: (4, 6)
H: (0, 6)
I: (0, 8)
Question 39. Plot the given points on a graph sheet.
(a) (5, 4)
(b) (2, 0)
(c) (3, 1)
(d) (0, 4)
(e) (4, 5)
Answer:
To plot these points on a graph sheet, first draw the horizontal x-axis and the vertical y-axis that intersect at the origin (0, 0). Label the axes and mark a suitable scale on both axes (e.g., 1 unit per grid square).
For each point $(x, y)$, we move $x$ units horizontally from the origin and $y$ units vertically from the origin. Positive values mean moving right for $x$ and up for $y$. Negative values mean moving left for $x$ and down for $y$.
Let's plot each point:
(a) (5, 4): Start at the origin (0, 0). Move 5 units to the right along the x-axis. From there, move 4 units upwards parallel to the y-axis. Mark this point.
(b) (2, 0): Start at the origin (0, 0). Move 2 units to the right along the x-axis. Since the y-coordinate is 0, we do not move up or down. The point lies on the x-axis. Mark this point.
(c) (3, 1): Start at the origin (0, 0). Move 3 units to the right along the x-axis. From there, move 1 unit upwards parallel to the y-axis. Mark this point.
(d) (0, 4): Start at the origin (0, 0). Since the x-coordinate is 0, we do not move left or right. Move 4 units upwards along the y-axis. The point lies on the y-axis. Mark this point.
(e) (4, 5): Start at the origin (0, 0). Move 4 units to the right along the x-axis. From there, move 5 units upwards parallel to the y-axis. Mark this point.
After marking all five points, you can label each point with its coordinates or a corresponding letter if they were labelled in the question (although they aren't in this specific question).
Note: A visual representation (image of the graph) would ideally accompany this explanation on a physical graph sheet. This text describes the steps taken to create that visual.
Question 40. Study the given map of a zoo and answer the following questions.
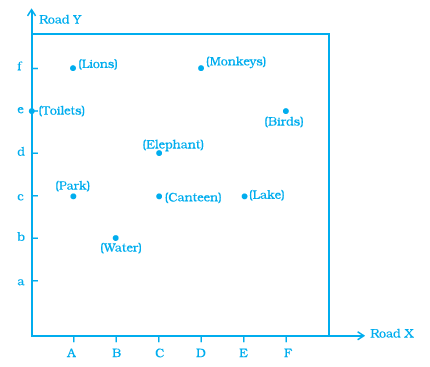
(a) Give the location of lions in the zoo.
(b) (D, f ) and (C, d) represent locations of which animals in the zoo?
(c) Where are the toilets located?
(d) Give the location of canteen.
Answer:
To answer the questions, we will use the grid system provided on the map. The location of an item is given by the pair of the column letter followed by the row letter, typically written as (Column, Row).
(a) Location of lions:
Locate the box labelled "Lions" on the map. This box is in the column labelled G and the row labelled f.
So, the location of the lions is (G, f).
(b) Animals at (D, f) and (C, d):
For location (D, f), find the column labelled D and the row labelled f. The box at this intersection contains the label "Monkey". So, (D, f) represents the location of the Monkey.
For location (C, d), find the column labelled C and the row labelled d. The box at this intersection contains the label "Crocodile". So, (C, d) represents the location of the Crocodile.
(c) Location of toilets:
Locate the box labelled "Toilets" on the map. This box is in the column labelled E and the row labelled c.
So, the location of the toilets is (E, c).
(d) Location of canteen:
Locate the box labelled "Canteen" on the map. This box is in the column labelled F and the row labelled c.
So, the location of the canteen is (F, c).
Question 41. Write the x -coordinate (abscissa) of each of the given points.
(a) (7, 3)
(b) (5, 7)
(c) (0, 5)
Answer:
In an ordered pair representing a point in the Cartesian coordinate system $(x, y)$, the first number, $x$, is the x-coordinate, also known as the abscissa. The second number, $y$, is the y-coordinate, also known as the ordinate.
We need to identify the first number in each given ordered pair.
(a) For the point (7, 3), the first number is 7. So, the x-coordinate (abscissa) is 7.
(b) For the point (5, 7), the first number is 5. So, the x-coordinate (abscissa) is 5.
(c) For the point (0, 5), the first number is 0. So, the x-coordinate (abscissa) is 0.
Question 42. Write the y-coordinate (ordinate) of each of the given points.
(a) (3, 5)
(b) (4, 0)
(c) (2, 7)
Answer:
In a Cartesian coordinate system, a point is represented by an ordered pair $(x, y)$. The first number, $x$, is the x-coordinate (or abscissa), and the second number, $y$, is the y-coordinate, also known as the ordinate.
We need to identify the second number in each given ordered pair.
(a) For the point (3, 5), the second number is 5. So, the y-coordinate (ordinate) is 5.
(b) For the point (4, 0), the second number is 0. So, the y-coordinate (ordinate) is 0.
(c) For the point (2, 7), the second number is 7. So, the y-coordinate (ordinate) is 7.
Question 43. Plot the given points on a graph sheet and check if the points lie on a straight line. If not, name the shape they form when joined in the given order.
(a) (1, 2), (2, 4), (3, 6), (4, 8).
(b) (1, 1), (1, 2), (2, 1), (2, 2).
(c) (4, 2), (2, 4), (3, 3), (5, 4).
Answer:
To solve this, we would plot each set of points on a separate graph sheet by drawing the x and y axes and marking the points based on their coordinates $(x, y)$. After plotting, we check if all points in a set lie on a single straight line. If they do not, we join the points in the given order (1st to 2nd, 2nd to 3rd, etc., and typically the last back to the first to form a closed shape) and identify the resulting shape.
(a) The given points are (1, 2), (2, 4), (3, 6), and (4, 8).
Plotting these points on a graph sheet shows that they all lie on a single straight line. We can also check this by observing the relationship between the coordinates: for each point $(x, y)$, $y$ is twice $x$ (i.e., $y = 2x$). This linear relationship confirms that the points are collinear.
Conclusion: The points lie on a straight line.
(b) The given points are (1, 1), (1, 2), (2, 1), and (2, 2).
Plotting these points on a graph sheet reveals they do not lie on a single straight line.
Joining the points in the given order (1,1) to (1,2), then (1,2) to (2,1), then (2,1) to (2,2), and finally connecting (2,2) back to (1,1) to form a closed shape results in a quadrilateral. However, the segments (1,2)-(2,1) and (2,2)-(1,1) cross each other. This type of polygon is called a crossed quadrilateral.
Conclusion: The points do not lie on a straight line. When joined in the given order (and closed), they form a crossed quadrilateral.
(c) The given points are (4, 2), (2, 4), (3, 3), and (5, 4).
Plotting these points shows they do not all lie on a single straight line. Let's check the collinearity of the first three points:
Slope of the line segment joining (4, 2) and (2, 4) is $\frac{4-2}{2-4} = \frac{2}{-2} = -1$.
Slope of the line segment joining (2, 4) and (3, 3) is $\frac{3-4}{3-2} = \frac{-1}{1} = -1$.
Since the slopes are equal, the points (4, 2), (2, 4), and (3, 3) are collinear, lying on the line $y = -x + 6$. The fourth point (5, 4) does not lie on this line ($4 \neq -5 + 6$).
When joined in the given order (4,2) to (2,4), then (2,4) to (3,3), then (3,3) to (5,4), and closing by joining (5,4) back to (4,2): Since the first three points are collinear, the path from (4,2) through (2,4) to (3,3) is a straight line segment from (4,2) to (3,3). Therefore, the closed shape formed by joining the points in order is effectively a triangle with vertices (4,2), (3,3), and (5,4), where the point (2,4) lies on the side connecting (4,2) and (3,3).
Conclusion: The points do not all lie on a straight line. When joined in the given order (and closed), they form a triangle (specifically, a degenerate quadrilateral where three vertices are collinear).
Question 44. If y–coordinate is 3 times x -coordinate, form a table for it and draw a graph.
Answer:
The given relation is that the y-coordinate is 3 times the x-coordinate. If we represent the x-coordinate by $x$ and the y-coordinate by $y$, the relation can be written as an equation:
$y = 3x$
To form a table, we choose some values for the independent variable $x$ and calculate the corresponding values for the dependent variable $y$ using the equation $y = 3x$. Let's choose a few simple integer values for $x$, including negative, zero, and positive values.
Table showing the coordinates $(x, y)$ for the relation $y = 3x$:
| x | y ($y = 3x$) | Point (x, y) |
| -2 | $3 \times (-2) = -6$ | (-2, -6) |
| -1 | $3 \times (-1) = -3$ | (-1, -3) |
| 0 | $3 \times 0 = 0$ | (0, 0) |
| 1 | $3 \times 1 = 3$ | (1, 3) |
| 2 | $3 \times 2 = 6$ | (2, 6) |
Now, we draw the graph using the points from the table.
Steps to draw the graph:
1. Draw two perpendicular lines on a graph sheet. The horizontal line is the x-axis, and the vertical line is the y-axis.
2. The point where the axes intersect is the origin (0, 0).
3. Label the positive directions of the x-axis (usually to the right) and the y-axis (usually upwards) with arrows.
4. Choose a suitable scale for both axes. For the points in our table, a scale of 1 unit per grid square on both axes will be appropriate.
5. Plot each point $(x, y)$ from the table on the graph sheet. For example, to plot (1, 3), start at the origin, move 1 unit to the right along the x-axis, and then move 3 units up parallel to the y-axis. Mark the point.
6. After plotting all the points (-2, -6), (-1, -3), (0, 0), (1, 3), and (2, 6), observe that they lie on a straight line. This is expected because the equation $y = 3x$ is a linear equation.
7. Draw a straight line passing through all the plotted points using a ruler. Extend the line beyond the points and add arrows at both ends to indicate that the line continues indefinitely.
8. Label the line with its equation: $y = 3x$.
The resulting graph will be a straight line passing through the origin with a slope of 3.
Question 45. Make a line graph for the area of a square as per the given table.
| Side (in cm) | 1 | 2 | 3 | 4 |
|---|---|---|---|---|
| Area (in cm2) | 1 | 4 | 9 | 16 |
Is it a linear graph?
Answer:
The given table provides the relationship between the side length of a square and its area. We can represent this data as points (Side, Area).
The points obtained from the table are:
(1, 1)
(2, 4)
(3, 9)
(4, 16)
To make a line graph, we will plot these points on a coordinate plane. Let the Side be represented on the x-axis and the Area be represented on the y-axis.
Plot the points (1,1), (2,4), (3,9), and (4,16). Then, connect these points with a line segment.
The resulting graph will be a curve that starts steep and becomes steeper as the side length increases.
The relationship between the side (x) and the area (y) of a square is given by the formula $y = x^2$. This is a quadratic relationship.
A linear graph is a graph that forms a straight line. Since the graph plotted from the given points is a curve, it is not a linear graph.
Question 46. The cost of a note book is Rs 10. Draw a graph after making a table showing cost of 2, 3, 4, .... note books. Use it to find
(a) the cost of 7 notebooks.
(b) The number of note books that can be purchased with Rs 50.
Answer:
Given:
Cost of one notebook is $\textsf{₹}10$.
To Find:
(a) A table showing the cost of 2, 3, 4, ... notebooks.
(b) A graph based on the table.
(c) The cost of 7 notebooks using the graph.
(d) The number of notebooks that can be purchased with $\textsf{₹}50$ using the graph.
Solution:
Let the number of notebooks be represented by $x$ and the total cost by $y$.
Since the cost of one notebook is $\textsf{₹}10$, the cost of $x$ notebooks will be $10 \times x$.
Thus, the relationship between the number of notebooks and the cost is given by the equation:
$y = 10x$
We can now create a table showing the cost of a few notebooks (e.g., from 1 to 6) to get points for the graph:
| Number of Notebooks (x) | Cost (y) in $\textsf{₹}$ ($y=10x$) | Point (x, y) |
| 1 | $10 \times 1 = 10$ | (1, 10) |
| 2 | $10 \times 2 = 20$ | (2, 20) |
| 3 | $10 \times 3 = 30$ | (3, 30) |
| 4 | $10 \times 4 = 40$ | (4, 40) |
| 5 | $10 \times 5 = 50$ | (5, 50) |
| 6 | $10 \times 6 = 60$ | (6, 60) |
Drawing the Graph:
Plot the points from the table on a coordinate plane. Let the Number of Notebooks be on the x-axis and the Cost be on the y-axis. Scale the axes appropriately. For instance, the x-axis can have units of 1 notebook, and the y-axis can have units of $\textsf{₹}10$ or $\textsf{₹}20$.
Plot the points (1, 10), (2, 20), (3, 30), (4, 40), (5, 50), (6, 60), and so on.
Since the relationship $y = 10x$ is a linear equation, the points will lie on a straight line passing through the origin (0, 0). Draw a straight line passing through these points, extending it as needed.
Using the Graph to find the cost of 7 notebooks:
To find the cost of 7 notebooks using the graph:
1. Locate the value 7 on the x-axis (Number of Notebooks).
2. From this point, draw a vertical line upwards until it meets the graph line.
3. From the point where the vertical line meets the graph line, draw a horizontal line to the left until it meets the y-axis (Cost).
4. Read the value on the y-axis. This value should be $\textsf{₹}70$.
Thus, the cost of 7 notebooks is $\textsf{₹}70$.
Using the Graph to find the number of notebooks for $\textsf{₹}50$:
To find the number of notebooks that can be purchased with $\textsf{₹}50$ using the graph:
1. Locate the value 50 on the y-axis (Cost).
2. From this point, draw a horizontal line to the right until it meets the graph line.
3. From the point where the horizontal line meets the graph line, draw a vertical line downwards until it meets the x-axis (Number of Notebooks).
4. Read the value on the x-axis. This value should be 5.
Thus, 5 notebooks can be purchased with $\textsf{₹}50$.
Question 47. Explain the situations represented by the following distance-time graphs.

Answer:
Let's analyze each distance-time graph provided:
Graph (i):
In this graph, the distance from the origin remains constant over time. This indicates that the object is stationary or at rest at a fixed position.
Graph (ii):
This graph is a straight line passing through the origin with a positive slope. This represents an object moving with uniform speed, starting from the origin (distance zero at time zero). The distance covered increases linearly with time.
Graph (iii):
This graph is a curve where the slope is increasing with time. Since the slope of a distance-time graph represents speed, an increasing slope means the speed of the object is increasing over time. This represents an object moving with non-uniform speed, specifically undergoing acceleration.
Graph (iv):
Similar to Graph (i), this graph shows the distance remaining constant over time. However, the initial distance is not zero. This means the object is stationary or at rest but is located at a fixed, non-zero distance from the origin.
Graph (v):
This graph is a straight line with a negative slope, starting at a positive distance on the y-axis. This indicates that the object is moving with uniform speed towards the origin (or starting point), reducing its distance from it linearly over time.
Graph (vi):
This graph is a curve where the slope is decreasing with time. This means the speed of the object is decreasing over time. This represents an object moving with non-uniform speed, specifically undergoing deceleration or retardation.
Question 48. Complete the given tables and draw a graph for each.
(a)
| x | 0 | 1 | 2 | 3 |
|---|---|---|---|---|
| y = 3x + 1 | 1 | 4 | ____ | ____ |
(b)
| x | 1 | 2 | 4 | 6 |
|---|---|---|---|---|
| y = x - 1 |
Answer:
We need to complete the given tables by substituting the values of $x$ into the respective equations for $y$. Then, we will describe how to draw the graph for each table.
(a) Equation: $y = 3x + 1$
We are given $x$ values $0, 1, 2, 3$. We need to find the corresponding $y$ values.
For $x = 0$: $y = 3(0) + 1 = 0 + 1 = 1$
For $x = 1$: $y = 3(1) + 1 = 3 + 1 = 4$
For $x = 2$: $y = 3(2) + 1 = 6 + 1 = 7$
For $x = 3$: $y = 3(3) + 1 = 9 + 1 = 10$
Completed Table:
| x | y = 3x + 1 | Point (x, y) |
| 0 | 1 | (0, 1) |
| 1 | 4 | (1, 4) |
| 2 | 7 | (2, 7) |
| 3 | 10 | (3, 10) |
Drawing the graph:
To draw the graph of $y = 3x + 1$, which is a linear equation, we need to plot the points from the completed table on a graph paper. The points are (0, 1), (1, 4), (2, 7), and (3, 10).
First, draw the x-axis (horizontal) and the y-axis (vertical). Label the origin (0,0).
Choose a suitable scale for both axes to accommodate the values in the table.
Plot each point (x, y) on the graph.
Since $y = 3x + 1$ is a linear equation, the points will lie on a straight line. Draw a straight line passing through all the plotted points.
This line represents the graph of the equation $y = 3x + 1$.
(b) Equation: $y = x - 1$
We are given $x$ values $1, 2, 4, 6$. We need to find the corresponding $y$ values.
For $x = 1$: $y = 1 - 1 = 0$
For $x = 2$: $y = 2 - 1 = 1$
For $x = 4$: $y = 4 - 1 = 3$
For $x = 6$: $y = 6 - 1 = 5$
Completed Table:
| x | y = x - 1 | Point (x, y) |
| 1 | 0 | (1, 0) |
| 2 | 1 | (2, 1) |
| 4 | 3 | (4, 3) |
| 6 | 5 | (6, 5) |
Drawing the graph:
To draw the graph of $y = x - 1$, which is also a linear equation, we need to plot the points from this completed table on a graph paper. The points are (1, 0), (2, 1), (4, 3), and (6, 5).
Draw the x-axis (horizontal) and the y-axis (vertical), and label the origin (0,0).
Choose an appropriate scale for both axes to accommodate the range of values.
Plot each point (x, y) on the graph.
Since $y = x - 1$ is a linear equation, these points will lie on a straight line. Draw a straight line passing through all the plotted points.
This line represents the graph of the equation $y = x - 1$.
Question 49. Study the given graphs (a) and (b) and complete the corresponding tables below.
(a)
.png "Page 381 Chapter 12 Class 8th NCERT Exemplar")
| x | 0 | 1 | 2 | 3 |
|---|---|---|---|---|
| y |
(b)
.png "Page 381 Chapter 12 Class 8th NCERT Exemplar")
| x | 0 | 1 | 2 | 3 | 4 |
|---|---|---|---|---|---|
| y |
Answer:
We need to read the corresponding $y$ values from the given graphs for the specified $x$ values and complete the tables.
(a) Graph (a):
Reading the $y$ values from the graph for the given $x$ values:
When $x = 0$, $y = 0$.
When $x = 1$, $y = 3$.
When $x = 2$, $y = 6$.
When $x = 3$, $y = 9$.
Completed Table:
| x | 0 | 1 | 2 | 3 |
| y | 0 | 3 | 6 | 9 |
(b) Graph (b):
Reading the $y$ values from the graph for the given $x$ values:
When $x = 0$, $y = 2$.
When $x = 1$, $y = 3$.
When $x = 2$, $y = 4$.
When $x = 3$, $y = 5$.
When $x = 4$, $y = 6$.
Completed Table:
| x | 0 | 1 | 2 | 3 | 4 |
| y | 2 | 3 | 4 | 5 | 6 |
Question 50. Draw a graph for the radius and circumference of circle using a suitable scale.
(Hint : Take radius = 7, 14, 21 units and so on)
From the graph,
(a) Find the circumference of the circle when radius is 42 units.
(b) At what radius will the circumference of the circle be 220 units?
Answer:
The circumference of a circle is related to its radius by the formula:
$C = 2\pi r$
To draw the graph, we need some data points. We will use the hint and take $\pi = \frac{22}{7}$ for simplicity in calculation, as the suggested radii are multiples of 7.
$C = 2 \times \frac{22}{7} \times r = \frac{44}{7} r$
Creating the Data Table:
Let's calculate the circumference $C$ for different values of radius $r$ as suggested and also include $r=0$.
For $r = 0$ units: $C = \frac{44}{7} \times 0 = 0$ units
For $r = 7$ units: $C = \frac{44}{7} \times 7 = 44$ units
For $r = 14$ units: $C = \frac{44}{7} \times 14 = 44 \times 2 = 88$ units
For $r = 21$ units: $C = \frac{44}{7} \times 21 = 44 \times 3 = 132$ units
We can add another point, say $r=28$ units:
For $r = 28$ units: $C = \frac{44}{7} \times 28 = 44 \times 4 = 176$ units
The table of values is:
| Radius $r$ (units) | Circumference $C = \frac{44}{7}r$ (units) | Point ($r$, $C$) |
| 0 | 0 | (0, 0) |
| 7 | 44 | (7, 44) |
| 14 | 88 | (14, 88) |
| 21 | 132 | (21, 132) |
| 28 | 176 | (28, 176) |
Drawing the Graph:
To draw the graph, follow these steps:
Draw two perpendicular axes on a graph paper. Label the horizontal axis as the Radius ($r$) and the vertical axis as the Circumference ($C$).
The intersection of the axes is the origin (0, 0).
Choose a suitable scale for both axes. For the radius axis, a scale of 7 units per grid division might be convenient (or 1 unit per division if the paper is large enough). For the circumference axis, a scale where values like 44, 88, etc., can be plotted easily is needed. For example, 20 units or 40 units per grid division.
Plot the points from the table: (0, 0), (7, 44), (14, 88), (21, 132), (28, 176).
Since the relationship $C = \frac{44}{7}r$ is linear (of the form $y = mx$), the graph will be a straight line passing through the origin. Draw a straight line that passes through all these plotted points.
This line represents the graph of the relationship between the radius and the circumference of a circle.
Using the Graph:
Once the graph is drawn, we can use it to answer the questions.
(a) Find the circumference of the circle when radius is 42 units.
Locate $r = 42$ on the horizontal (radius) axis. This value is outside the range of the points plotted in our table (0 to 28). To find the circumference from the graph, you would need to extend the straight line you drew.
From $r=42$ on the radius axis, move vertically upwards until you intersect the extended graph line. From that intersection point, move horizontally to the left to the circumference (vertical) axis. The value where you intersect the circumference axis is the circumference for a radius of 42 units.
Using the formula to verify the expected value:
$C = \frac{44}{7} \times 42 = 44 \times 6 = 264$
So, from the graph (by extending the line), the circumference for a radius of 42 units will be 264 units.
(b) At what radius will the circumference of the circle be 220 units?
Locate $C = 220$ on the vertical (circumference) axis. This value is also likely outside or near the edge of the initially plotted points (up to 176).
From $C=220$ on the circumference axis, move horizontally to the right until you intersect the graph line (extend the line if necessary). From that intersection point, move vertically downwards to the radius (horizontal) axis. The value where you intersect the radius axis is the radius for a circumference of 220 units.
Using the formula to verify the expected value:
$220 = \frac{44}{7} \times r$
$r = 220 \times \frac{7}{44} = 5 \times 7 = 35$
So, from the graph, the radius for a circumference of 220 units will be 35 units.
Question 51. The graph shows the maximum temperatures recorded for two consecutive weeks of a town. Study the graph and answer the questions that follow.
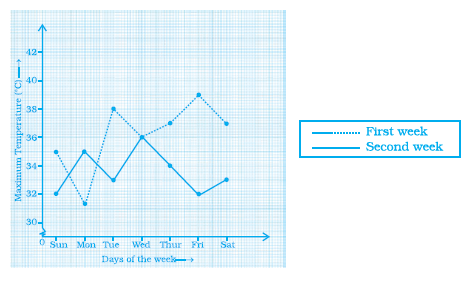
(a) What information is given by the two axes?
(b) In which week was the temperature higher on most of the days?
(c) On which day was the temperature same in both the weeks?
(d) On which day was the difference in temperatures the maximum for both the weeks?
(e) What were the temperatures for both the weeks on Thursday?
(f) On which day was the temperature 35°C for the first week?
(g) On which day was the temperature highest for the second week?
Answer:
Let's analyze the given graph and answer the questions.
(a) What information is given by the two axes?
The horizontal axis (x-axis) represents the Days of the Week, starting from Monday and ending on Sunday.
The vertical axis (y-axis) represents the Maximum Temperature recorded, measured in degrees Celsius ($^\circ$C).
(b) In which week was the temperature higher on most of the days?
By observing the graph, the line representing Week 1 is generally higher than the line representing Week 2 for most of the days (Monday, Tuesday, Wednesday, Friday, Saturday, Sunday). Only on Thursday, the temperature is the same or slightly lower in Week 1.
Therefore, the temperature was higher in Week 1 on most of the days.
(c) On which day was the temperature same in both the weeks?
The temperature was the same in both weeks on the day where the two lines intersect. Looking at the graph, the lines intersect on Thursday.
So, the temperature was the same in both weeks on Thursday.
(d) On which day was the difference in temperatures the maximum for both the weeks?
We need to find the day where the vertical distance between the two lines is the largest.
Monday: Week 1 approx. 33°C, Week 2 approx. 29°C. Difference = $33 - 29 = 4^\circ$C
Tuesday: Week 1 approx. 34°C, Week 2 approx. 30.5°C. Difference = $34 - 30.5 = 3.5^\circ$C
Wednesday: Week 1 approx. 34.5°C, Week 2 approx. 31°C. Difference = $34.5 - 31 = 3.5^\circ$C
Thursday: Week 1 approx. 32.5°C, Week 2 approx. 32.5°C. Difference = $32.5 - 32.5 = 0^\circ$C
Friday: Week 1 approx. 35°C, Week 2 approx. 33°C. Difference = $35 - 33 = 2^\circ$C
Saturday: Week 1 approx. 35.5°C, Week 2 approx. 33.5°C. Difference = $35.5 - 33.5 = 2^\circ$C
Sunday: Week 1 approx. 36°C, Week 2 approx. 34.5°C. Difference = $36 - 34.5 = 1.5^\circ$C
The maximum difference is $4^\circ$C, which occurred on Monday.
(e) What were the temperatures for both the weeks on Thursday?
On Thursday, the temperature for Week 1 (blue line) is approximately 32.5°C.
On Thursday, the temperature for Week 2 (red line) is approximately 32.5°C.
The temperatures were 32.5°C for both weeks on Thursday.
(f) On which day was the temperature 35°C for the first week?
Find the point on the blue line (Week 1) where the temperature is 35°C on the vertical axis. Trace horizontally from 35°C to the blue line, and then trace vertically down to the day on the horizontal axis.
This point corresponds to Friday.
So, the temperature was 35°C for the first week on Friday.
(g) On which day was the temperature highest for the second week?
Look for the highest point on the red line (Week 2). The highest point on the red line occurs on Sunday.
The highest temperature for the second week was approximately 34.5°C on Sunday.
So, the temperature was highest for the second week on Sunday.
Question 52. The gra ph given below gives the actual and expected sales of cars of a company for 6 months. Study the graph and answer the questions that follow.

(a) In which month was the actual sales same as the expected sales?
(b) For which month(s) was (were) the difference in actual and expected sales the maximum?
(c) For which month(s) was (were) the difference in actual and expected sales the least?
(d) What was the total sales of cars in the months–Jan, Feb. and March?
(e) What is the average sales of cars in the last three months?
(f) Find the ratio of sales in the first three months to the last three months.
Answer:
Let's study the given graph and answer the questions based on the actual and expected sales of cars.
(a) In which month was the actual sales same as the expected sales?
The actual sales and expected sales are the same in the month where the red line (Actual Sales) and the blue line (Expected Sales) intersect. Looking at the graph, the lines do not intersect at any specific month marking point within the 6 months shown. However, we can see the values for each month.
Jan: Actual 600, Expected 500
Feb: Actual 700, Expected 600
Mar: Actual 800, Expected 700
Apr: Actual 400, Expected 800
May: Actual 500, Expected 900
Jun: Actual 600, Expected 1000
Based on the given data points on the graph for each month, the actual sales were never exactly the same as the expected sales in any of these 6 months.
(b) For which month(s) was (were) the difference in actual and expected sales the maximum?
We calculate the absolute difference between actual and expected sales for each month:
January: $|600 - 500| = 100$
February: $|700 - 600| = 100$
March: $|800 - 700| = 100$
April: $|400 - 800| = |-400| = 400$
May: $|500 - 900| = |-400| = 400$
June: $|600 - 1000| = |-400| = 400$
The maximum difference is 400, which occurred in April, May, and June.
(c) For which month(s) was (were) the difference in actual and expected sales the least?
Referring to the differences calculated in part (b), the least difference is 100, which occurred in January, February, and March.
(d) What was the total sales of cars in the months – Jan, Feb. and March?
Total actual sales in Jan, Feb, and Mar = Actual Sales (Jan) + Actual Sales (Feb) + Actual Sales (Mar)
Total sales = $600 + 700 + 800 = 2100$
The total sales of cars in January, February, and March was 2100.
(e) What is the average sales of cars in the last three months?
The last three months are April, May, and June.
Total actual sales in Apr, May, and Jun = Actual Sales (Apr) + Actual Sales (May) + Actual Sales (Jun)
Total sales = $400 + 500 + 600 = 1500$
Average sales = $\frac{\text{Total sales in last three months}}{\text{Number of months}}$
Average sales = $\frac{1500}{3} = 500$
The average sales of cars in the last three months was 500.
(f) Find the ratio of sales in the first three months to the last three months.
Total sales in the first three months (Jan, Feb, Mar) = 2100 (from part d)
Total sales in the last three months (Apr, May, Jun) = 1500 (from part e)
Ratio = $\frac{\text{Total sales in first three months}}{\text{Total sales in last three months}} = \frac{2100}{1500}$
Simplifying the ratio:
$\frac{\cancel{2100}^{21}}{\cancel{1500}_{15}} = \frac{21}{15} = \frac{\cancel{21}^7}{\cancel{15}_5} = \frac{7}{5}$
The ratio of sales in the first three months to the last three months is 7:5.
Question 53. The graph given below shows the marks obtained out of 10 by Sonia in two different tests. Study the graph and answer the questions that follow.
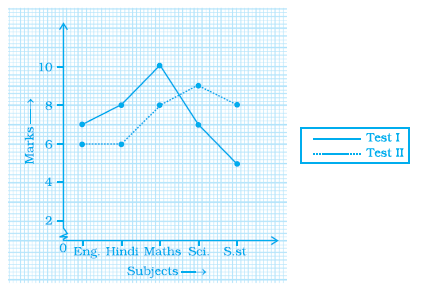
(a) What information is represented by the axes?
(b) In which subject did she score the highest in Test I?
(c) In which subject did she score the least in Test II?
(d) In which subject did she score the same marks in both the Tests?
(e) What are the marks scored by her in English in Test II?
(f) In which test was the performance better?
(g) In which subject and which test did she score full marks?
Answer:
Let's analyze the given graph and answer the questions based on Sonia's marks in two tests.
(a) What information is represented by the axes?
The horizontal axis (x-axis) represents the Subjects (Hindi, English, Maths, Science, Social Science).
The vertical axis (y-axis) represents the Marks Obtained out of 10.
(b) In which subject did she score the highest in Test I?
Looking at the blue line which represents Test I, the highest point is for Maths, where she scored 10 marks.
She scored the highest in Test I in Maths.
(c) In which subject did she score the least in Test II?
Looking at the red line which represents Test II, the lowest point is for Social Science, where she scored 6 marks.
She scored the least in Test II in Social Science.
(d) In which subject did she score the same marks in both the Tests?
The marks were the same in both tests for the subject where the blue line and the red line are at the same level. This occurs for Science, where she scored 8 marks in both tests.
She scored the same marks in both tests in Science.
(e) What are the marks scored by her in English in Test II?
Locate English on the horizontal axis. Find the red point (Test II) above English. The corresponding mark on the vertical axis is 8.
The marks scored by her in English in Test II is 8.
(f) In which test was the performance better?
To determine which test had better performance, we can compare the total marks obtained in each test.
Total marks in Test I = Marks (Hindi) + Marks (English) + Marks (Maths) + Marks (Science) + Marks (Social Science)
Total marks in Test I = $6 + 7 + 10 + 8 + 5 = 36$
Total marks in Test II = Marks (Hindi) + Marks (English) + Marks (Maths) + Marks (Science) + Marks (Social Science)
Total marks in Test II = $7 + 8 + 9 + 8 + 6 = 38$
Since the total marks in Test II (38) are higher than in Test I (36), the performance was better in Test II.
(g) In which subject and which test did she score full marks?
Full marks are 10. Looking at the graph, she scored 10 marks in Maths in Test I (blue line).
She scored full marks in Maths in Test I.
Question 54. Find the coordinates of the vertices of the given figures.

Answer:
To find the coordinates of the vertices of the given figures, we read the x-value (horizontal position) and the y-value (vertical position) for each vertex on the coordinate plane.
Coordinates of the vertices of Triangle PQR:
The vertices are P, Q, and R.
Vertex P: Located at x = 1 and y = 1. The coordinates are (1, 1).
Vertex Q: Located at x = 2 and y = 3. The coordinates are (2, 3).
Vertex R: Located at x = 3 and y = 1. The coordinates are (3, 1).
Coordinates of the vertices of Quadrilateral ABCD:
The vertices are A, B, C, and D.
Vertex A: Located at x = 5 and y = 3. The coordinates are (5, 3).
Vertex B: Located at x = 6 and y = 5. The coordinates are (6, 5).
Vertex C: Located at x = 8 and y = 4. The coordinates are (8, 4).
Vertex D: Located at x = 6 and y = 2. The coordinates are (6, 2).
Coordinates of the vertices of Quadrilateral EFGH:
The vertices are E, F, G, and H.
Vertex E: Located at x = 9 and y = 6. The coordinates are (9, 6).
Vertex F: Located at x = 11 and y = 8. The coordinates are (11, 8).
Vertex G: Located at x = 11 and y = 3. The coordinates are (11, 3).
Vertex H: Located at x = 9 and y = 2. The coordinates are (9, 2).
Question 55. Study the graph given below of a person who started from his home and returned at the end of the day. Answer the questions that follow.

(a) At what time did the person start from his home?
(b) How much distance did he travel in the first four hours of his journey?
(c) What was he doing from 3 pm to 5 pm?
(d) What was the total distance travelled by him throughout the day?
(e) Calculate the distance covered by him in the first 8 hours of his journey.
(f) At what time did he cover 16 km of his journey?
(g) Calculate the average speed of the man from (a) A to B (b) B to C (c) At what time did he return home?
Answer:
Let's analyze the given distance-time graph for the person's journey.
(a) At what time did the person start from his home?
The graph starts at the point where the Distance from Home is 0 km. This corresponds to the initial time on the horizontal axis.
From the graph, the starting time is 8 am.
(b) How much distance did he travel in the first four hours of his journey?
The journey starts at 8 am. Four hours after 8 am is 12 pm.
At 8 am, the distance from home is 0 km.
At 12 pm, the distance from home is 16 km (point A on the graph).
Since the distance increased from 0 km to 16 km during this time, the distance travelled is $16 \text{ km} - 0 \text{ km} = 16 \text{ km}$.
He travelled 16 km in the first four hours.
(c) What was he doing from 3 pm to 5 pm?
Let's look at the graph between 3 pm and 5 pm. At 3 pm (point B), the distance from home is 16 km. At 5 pm (point C), the distance from home is 32 km.
Since the distance from home is increasing, the person was travelling away from home during this time.
He was travelling away from home from 3 pm to 5 pm.
(d) What was the total distance travelled by him throughout the day?
The total distance travelled is the sum of the distances covered during periods of movement (when the distance from home is changing).
From 8 am to 12 pm (OA): Distance changed from 0 km to 16 km. Distance travelled = 16 km.
From 12 pm to 3 pm (AB): Distance remained constant at 16 km. Distance travelled = 0 km (He was stopped).
From 3 pm to 5 pm (BC): Distance changed from 16 km to 32 km. Distance travelled = $32 - 16 = 16$ km.
From 5 pm to 7 pm (CD): Distance remained constant at 32 km. Distance travelled = 0 km (He was stopped).
From 7 pm to 8 pm (DE): Distance changed from 32 km to 0 km. Distance travelled = $32 - 0 = 32$ km.
Total distance travelled = $16 \text{ km} + 0 \text{ km} + 16 \text{ km} + 0 \text{ km} + 32 \text{ km} = 64 \text{ km}$.
The total distance travelled by him throughout the day was 64 km.
(e) Calculate the distance covered by him in the first 8 hours of his journey.
The first 8 hours of his journey are from 8 am to 4 pm.
From 8 am to 12 pm (first 4 hours): Distance covered = 16 km.
From 12 pm to 3 pm (next 3 hours): Distance covered = 0 km (stopped).
From 3 pm to 4 pm (the 8th hour): This is part of the segment BC. The segment BC represents travel from 3 pm to 5 pm (2 hours) covering a distance of $32 \text{ km} - 16 \text{ km} = 16 \text{ km}$. The speed during BC is $\frac{16 \text{ km}}{2 \text{ hours}} = 8 \text{ km/h}$. In the first hour of this segment (from 3 pm to 4 pm), the distance covered is $8 \text{ km/h} \times 1 \text{ hour} = 8 \text{ km}$.
Total distance covered in the first 8 hours (8 am to 4 pm) = Distance (8 am to 12 pm) + Distance (12 pm to 3 pm) + Distance (3 pm to 4 pm)
Total distance covered = $16 \text{ km} + 0 \text{ km} + 8 \text{ km} = 24 \text{ km}$.
The distance covered by him in the first 8 hours of his journey was 24 km.
(f) At what time did he cover 16 km of his journey?
The total cumulative distance travelled is 16 km when the distance from home first reaches 16 km. This occurs at point A on the graph.
Point A is at 12 pm.
He covered 16 km of his journey at 12 pm.
(g) Calculate the average speed of the man from (a) A to B (b) B to C (c) At what time did he return home?
The formula for average speed is: Average Speed = $\frac{\text{Distance Covered}}{\text{Time Taken}}$
(a) Average speed from A to B:
Point A is at 12 pm, 16 km from home.
Point B is at 3 pm, 16 km from home.
Time taken = 3 pm - 12 pm = 3 hours.
Distance covered during this period = Change in distance from home = $16 \text{ km} - 16 \text{ km} = 0 \text{ km}$.
Average speed = $\frac{0 \text{ km}}{3 \text{ hours}} = 0 \text{ km/h}$.
The average speed from A to B was 0 km/h (He was stopped).
(b) Average speed from B to C:
Point B is at 3 pm, 16 km from home.
Point C is at 5 pm, 32 km from home.
Time taken = 5 pm - 3 pm = 2 hours.
Distance covered during this period = Change in distance from home = $32 \text{ km} - 16 \text{ km} = 16 \text{ km}$.
Average speed = $\frac{16 \text{ km}}{2 \text{ hours}} = 8 \text{ km/h}$.
The average speed from B to C was 8 km/h.
(c) At what time did he return home?
He returned home when his distance from home is 0 km again. This is the end point of the graph.
From the graph, this occurs at 8 pm.
Question 56. Plot a line graph for the variables p and q where p is two times q i.e, the equation is p = 2q. Then find.
(a) the value of p when q = 3
(b) the value of q when p = 8
Answer:
We are asked to plot a line graph for the equation relating variables $p$ and $q$, where $p$ is two times $q$, which can be written as:
$p = 2q$
To plot the graph, we need to find some coordinate pairs $(q, p)$ that satisfy this equation. We can choose some values for $q$ and calculate the corresponding values for $p$.
Creating the Data Table:
Let's choose a few simple values for $q$ (e.g., 0, 1, 2, 3, 4) and calculate $p$ using $p = 2q$:
If $q = 0$, $p = 2 \times 0 = 0$. The point is (0, 0).
If $q = 1$, $p = 2 \times 1 = 2$. The point is (1, 2).
If $q = 2$, $p = 2 \times 2 = 4$. The point is (2, 4).
If $q = 3$, $p = 2 \times 3 = 6$. The point is (3, 6).
If $q = 4$, $p = 2 \times 4 = 8$. The point is (4, 8).
Here is the table of values:
| q | p = 2q | Point (q, p) |
| 0 | 0 | (0, 0) |
| 1 | 2 | (1, 2) |
| 2 | 4 | (2, 4) |
| 3 | 6 | (3, 6) |
| 4 | 8 | (4, 8) |
Drawing the Graph:
To draw the line graph, follow these steps:
Draw two perpendicular axes on a graph paper. Since $p=2q$ means $p$ is directly proportional to $q$ and passes through (0,0), it's convenient to use the horizontal axis for $q$ and the vertical axis for $p$. Label the horizontal axis as 'q' and the vertical axis as 'p'.
The intersection of the axes is the origin (0, 0).
Choose a suitable scale for both axes. A scale of 1 unit per grid division for both axes would work well for the points we have.
Plot the points from the table on the graph paper: (0, 0), (1, 2), (2, 4), (3, 6), and (4, 8).
Since the equation $p = 2q$ is a linear equation, the points will lie on a straight line. Draw a straight line that passes through all the plotted points. Extend the line in both directions if needed.
This straight line is the graph of the equation $p = 2q$.
Now, we will use the graph to find the required values:
(a) the value of p when q = 3
To find the value of $p$ when $q = 3$ using the graph:
Locate $q = 3$ on the horizontal (q) axis.
Move vertically upwards from $q=3$ until you reach the line graph.
From the point where you meet the line, move horizontally to the left to the vertical (p) axis.
Read the value on the p-axis. You will find that the value is 6.
Thus, when $q = 3$, the value of $p$ is 6.
(Verification: Using the equation $p=2q$, for $q=3$, $p = 2 \times 3 = 6$).
(b) the value of q when p = 8
To find the value of $q$ when $p = 8$ using the graph:
Locate $p = 8$ on the vertical (p) axis.
Move horizontally to the right from $p=8$ until you reach the line graph.
From the point where you meet the line, move vertically downwards to the horizontal (q) axis.
Read the value on the q-axis. You will find that the value is 4.
Thus, when $p = 8$, the value of $q$ is 4.
(Verification: Using the equation $p=2q$, for $p=8$, $8 = 2q \implies q = \frac{8}{2} = 4$).
Question 57. Study the graph and answer the questions that follow.
(a) What information does the graph give?
(b) On which day was the temperature the least?
(c) On which day was the temperature 31°C?
(d) Which was the hottest day?

Answer:
Let's study the given graph and answer the questions.
(a) What information does the graph give?
The graph shows the temperature recorded on different days of a week.
The horizontal axis represents the Days of the Week (from Monday to Sunday).
The vertical axis represents the Temperature in degrees Celsius ($^\circ$C).
(b) On which day was the temperature the least?
To find the day with the least temperature, we need to find the lowest point on the graph. The lowest point is above Wednesday, where the temperature is 25°C.
The temperature was the least on Wednesday.
(c) On which day was the temperature 31°C?
To find the day when the temperature was 31°C, locate 31°C on the vertical (temperature) axis. Move horizontally to the right until you meet the graph line. Then, move vertically downwards to the horizontal (day) axis.
The graph point at 31°C corresponds to Friday.
The temperature was 31°C on Friday.
(d) Which was the hottest day?
To find the hottest day, we need to find the day with the highest temperature, which corresponds to the highest point on the graph. The highest point is above Sunday, where the temperature is 35°C.
The hottest day was Sunday.
Question 58. Study the distance-time graph given below for a car to travel to certain places and answer the questions that follow.
(a) How far does the car travel in 2 hours?
(b) How much time does the car take to reach R?
(c) How long does the car take to cover 80 km?
(d) How far is Q from the starting point?
(e) When does the car reach the place S after starting?
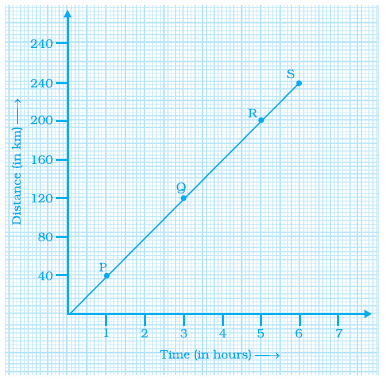
Answer:
Let's study the given distance-time graph for the car's journey and answer the questions.
(a) How far does the car travel in 2 hours?
Find the point on the horizontal axis corresponding to 2 hours. Move vertically up to the graph line. Then, move horizontally to the left to the vertical axis.
At 2 hours, the distance from the starting point is 40 km.
The car travels 40 km in 2 hours.
(b) How much time does the car take to reach R?
Locate point R on the graph. R is at a distance of 120 km from the starting point.
Move horizontally from R to the left to the vertical axis to confirm the distance (120 km).
Move vertically downwards from R to the horizontal axis to read the time.
Point R is reached at 4 hours.
The car takes 4 hours to reach R.
(c) How long does the car take to cover 80 km?
Find the point on the vertical axis corresponding to 80 km. Move horizontally to the right until you reach the graph line. Then, move vertically downwards to the horizontal axis.
The graph line reaches 80 km at 3 hours.
The car takes 3 hours to cover 80 km.
(d) How far is Q from the starting point?
Locate point Q on the graph. Move horizontally from Q to the left to the vertical axis to read the distance from the starting point.
Point Q is at a distance of 80 km from the starting point.
Q is 80 km far from the starting point.
(e) When does the car reach the place S after starting?
Locate point S on the graph. Move vertically downwards from S to the horizontal axis to read the time after starting.
Point S is reached at 6 hours after starting.
The car reaches place S after starting at 6 hours.
Question 59. Locate the points A (1,2), B (4,2) and C (1,4) on a graph sheet taking suitable axes. Write the coordinates of the fourth point D to complete the rectangle ABCD.
Answer:
To locate the points A (1,2), B (4,2), and C (1,4) on a graph sheet and find the coordinates of the fourth point D to complete the rectangle ABCD, follow these steps:
Plotting the Points:
Draw two perpendicular lines on a graph sheet. The horizontal line is the x-axis, and the vertical line is the y-axis. Their intersection is the origin (0, 0).
Choose a suitable scale for both axes (e.g., 1 unit per grid square).
To plot a point $(x, y)$, start from the origin, move $x$ units along the x-axis (right if $x$ is positive, left if $x$ is negative), and then move $y$ units parallel to the y-axis (up if $y$ is positive, down if $y$ is negative).
- Point A (1,2): Start from (0,0), move 1 unit right along the x-axis, then 2 units up parallel to the y-axis. Mark this point as A.
- Point B (4,2): Start from (0,0), move 4 units right along the x-axis, then 2 units up parallel to the y-axis. Mark this point as B.
- Point C (1,4): Start from (0,0), move 1 unit right along the x-axis, then 4 units up parallel to the y-axis. Mark this point as C.
Connect points A to B and A to C. You will see that AB is a horizontal line segment and AC is a vertical line segment. Since AB is horizontal (both A and B have the same y-coordinate, 2) and AC is vertical (both A and C have the same x-coordinate, 1), they form a right angle at A, which is expected for a rectangle's corner.
Finding the Coordinates of Point D:
To complete the rectangle ABCD, point D must be positioned such that CD is parallel and equal to AB, and BD is parallel and equal to AC.
Alternatively, consider the coordinates:
- Since AB is a horizontal segment, CD must also be a horizontal segment. This means point D will have the same y-coordinate as point C ($y$-coordinate of C is 4).
- Since AC is a vertical segment, BD must also be a vertical segment. This means point D will have the same x-coordinate as point B ($x$-coordinate of B is 4).
Therefore, the x-coordinate of D is 4, and the y-coordinate of D is 4.
The coordinates of the fourth point D to complete the rectangle ABCD are (4, 4).
On the graph, you would locate the point by moving 4 units right from the origin along the x-axis and then 4 units up parallel to the y-axis. Connecting C to D and B to D will form the rectangle ABCD.
Question 60. Locate the points A(1,2), B (3,4) and C (5,2) on a graph sheet taking suitable axes. Write the coordinates of the fourth point D to complete the rhombus ABCD. Measure the diagonals of this rhombus and find whether they are equal or not.
Answer:
To locate the points and find the coordinates of the fourth point to complete the rhombus, we follow these steps:
Plotting the Points:
Draw a coordinate plane with the x-axis and y-axis on a graph sheet. Choose a suitable scale, for example, 1 unit per grid square.
- Point A (1,2): Start from the origin, move 1 unit right, then 2 units up. Mark the point A.
- Point B (3,4): Start from the origin, move 3 units right, then 4 units up. Mark the point B.
- Point C (5,2): Start from the origin, move 5 units right, then 2 units up. Mark the point C.
Connect points A to B and B to C. Also connect A to C. You will see that points A and C lie on the horizontal line $y=2$.
Finding the Coordinates of Point D:
A rhombus is a parallelogram, and the diagonals of a parallelogram bisect each other. Therefore, the midpoint of the diagonal AC must be the same as the midpoint of the diagonal BD.
Let the coordinates of the fourth point D be $(x, y)$.
The midpoint of AC is given by: $\left(\frac{x_A + x_C}{2}, \frac{y_A + y_C}{2}\right) = \left(\frac{1 + 5}{2}, \frac{2 + 2}{2}\right) = \left(\frac{6}{2}, \frac{4}{2}\right) = (3, 2)$
The midpoint of BD is given by: $\left(\frac{x_B + x_D}{2}, \frac{y_B + y_D}{2}\right) = \left(\frac{3 + x}{2}, \frac{4 + y}{2}\right)$
Equating the coordinates of the midpoints:
$\frac{3 + x}{2} = 3$
$3 + x = 6$
$x = 6 - 3$
$x = 3$
$\frac{4 + y}{2} = 2$
$4 + y = 4$
$y = 4 - 4$
$y = 0$
So, the coordinates of the fourth point D are (3, 0).
Measuring the Diagonals:
The diagonals of the rhombus are AC and BD.
Length of diagonal AC: Using the distance formula, the distance between A(1,2) and C(5,2) is:
AC = $\sqrt{(x_C - x_A)^2 + (y_C - y_A)^2}$
AC = $\sqrt{(5 - 1)^2 + (2 - 2)^2}$
AC = $\sqrt{4^2 + 0^2}$
AC = $\sqrt{16 + 0}$
AC = $\sqrt{16}$
AC = 4 units
Length of diagonal BD: Using the distance formula, the distance between B(3,4) and D(3,0) is:
BD = $\sqrt{(x_D - x_B)^2 + (y_D - y_B)^2}$
BD = $\sqrt{(3 - 3)^2 + (0 - 4)^2}$
BD = $\sqrt{0^2 + (-4)^2}$
BD = $\sqrt{0 + 16}$
BD = $\sqrt{16}$
BD = 4 units
Comparison of Diagonals:
We found that the length of diagonal AC is 4 units and the length of diagonal BD is 4 units.
Since AC = BD = 4 units, the diagonals of this rhombus are equal.
Note: A rhombus with equal diagonals is a square. In this case, ABCD is a square.
Question 61. Locate the points P (3,4), Q (1,0), R (0,4), S (4,1) on a graph sheet and write the coordinates of the point of intersection of line segments PQ and RS.
Answer:
To locate the given points on a graph sheet, draw the line segments PQ and RS, and find their point of intersection, follow these steps:
Plotting the Points:
Draw a coordinate plane on a graph sheet. Draw a horizontal line and label it as the x-axis. Draw a vertical line perpendicular to the x-axis and label it as the y-axis. The point where they intersect is the origin (0, 0).
Choose a suitable scale for both axes, for example, 1 unit per grid square.
Now, plot the given points:
- Point P (3,4): Start from the origin, move 3 units to the right along the x-axis, then move 4 units upwards parallel to the y-axis. Mark this point as P.
- Point Q (1,0): Start from the origin, move 1 unit to the right along the x-axis, then move 0 units up or down. This point is on the x-axis. Mark this point as Q.
- Point R (0,4): Start from the origin, move 0 units to the right or left, then move 4 units upwards parallel to the y-axis. This point is on the y-axis. Mark this point as R.
- Point S (4,1): Start from the origin, move 4 units to the right along the x-axis, then move 1 unit upwards parallel to the y-axis. Mark this point as S.
Drawing the Line Segments:
Draw a straight line segment connecting point P to point Q. This is the line segment PQ.
Draw another straight line segment connecting point R to point S. This is the line segment RS.
Finding the Point of Intersection:
Observe the graph where the line segment PQ crosses or intersects the line segment RS. This point is the point of intersection.
Read the coordinates of this intersection point from the graph. To do this, drop a vertical line from the intersection point to the x-axis to read the x-coordinate, and draw a horizontal line from the intersection point to the y-axis to read the y-coordinate.
Based on the graph, the line segments PQ and RS intersect at the point where the x-coordinate is 2 and the y-coordinate is 2.
The coordinates of the point of intersection of line segments PQ and RS are (2, 2).
Question 62. The graph given below compares the sales of ice creams of two vendors for a week.

Observe the graph and answer the following questions.
(a) Which vendor has sold more icecreams on Friday?
(b) For which day was the sales same for both the vendors?
(c) On which day did the sale of vendor A increase the most as compared to the previous day?
(d) On which day was the difference in sales the maximum?
(e) On which two days was the sales same for vendor B?
Answer:
Let's analyze the given line graph comparing the sales of ice creams for two vendors, Vendor A and Vendor B, over a week.
(a) Which vendor has sold more icecreams on Friday?
On Friday, the sales for Vendor A (blue line) is 70, and the sales for Vendor B (red line) is 50.
Since $70 > 50$, Vendor A sold more icecreams on Friday.
(b) For which day was the sales same for both the vendors?
The sales were the same for both vendors on the day where the blue line and the red line intersect. Looking at the graph, the lines intersect on Sunday, where both vendors sold 80 icecreams.
The sales were the same for both vendors on Sunday.
(c) On which day did the sale of vendor A increase the most as compared to the previous day?
Let's calculate the increase in sales for Vendor A each day compared to the previous day:
Monday: No previous day shown.
Tuesday compared to Monday: $50 - 30 = 20$
Wednesday compared to Tuesday: $60 - 50 = 10$
Thursday compared to Wednesday: $80 - 60 = 20$
Friday compared to Thursday: $70 - 80 = -10$ (decrease)
Saturday compared to Friday: $90 - 70 = 20$
Sunday compared to Saturday: $80 - 90 = -10$ (decrease)
The largest increase is 20. This occurred on Tuesday (compared to Monday), Thursday (compared to Wednesday), and Saturday (compared to Friday).
The sale of vendor A increased the most as compared to the previous day on Tuesday, Thursday, and Saturday.
(d) On which day was the difference in sales the maximum?
Let's calculate the absolute difference in sales between Vendor A and Vendor B for each day:
Monday: $|30 - 40| = 10$
Tuesday: $|50 - 60| = 10$
Wednesday: $|60 - 30| = 30$
Thursday: $|80 - 40| = 40$
Friday: $|70 - 50| = 20$
Saturday: $|90 - 80| = 10$
Sunday: $|80 - 80| = 0$
The maximum difference in sales is 40, which occurred on Thursday.
(e) On which two days was the sales same for vendor B?
Looking at the red line (Vendor B), we need to find two days where the sales value is the same.
- Monday: 40
- Tuesday: 60
- Wednesday: 30
- Thursday: 40
- Friday: 50
- Saturday: 80
- Sunday: 80
The sales for Vendor B was 40 on Monday and Thursday. The sales for Vendor B was 80 on Saturday and Sunday.
There are two pairs of days where the sales were the same for vendor B: Monday and Thursday (sales of 40), and Saturday and Sunday (sales of 80).
Question 63. The table given below shows the temperatures recorded on a day at different times.

Observe the table and answer the following questions.
(a) What is the temperature at 8 am?
(b) At what time is the temperature 3°C?
(c) During which hour did the temperature fall?
(d) What is the change in temperature between 7 am and 10 am?
(e) During which hour was there a constant temperature?
Answer:
Let's answer the questions based on the provided table of temperatures at different times.
(a) What is the temperature at 8 am?
Look at the table. Find the row where the Time is "8 am". The corresponding Temperature is 8°C.
The temperature at 8 am is 8°C.
(b) At what time is the temperature 3°C?
Look at the table. Find the row where the Temperature is "3°C". The corresponding Time is 6 pm and 7 pm.
The temperature is 3°C at 6 pm and 7 pm.
(c) During which hour did the temperature fall?
We need to look for intervals where the temperature decreased from one reading to the next.
10 am (14°C) to 11 am (12°C) - Fall ($14 > 12$)
11 am (12°C) to 12 pm (10°C) - Fall ($12 > 10$)
1 pm (10°C) to 2 pm (8°C) - Fall ($10 > 8$)
2 pm (8°C) to 3 pm (6°C) - Fall ($8 > 6$)
3 pm (6°C) to 4 pm (5°C) - Fall ($6 > 5$)
4 pm (5°C) to 5 pm (4°C) - Fall ($5 > 4$)
5 pm (4°C) to 6 pm (3°C) - Fall ($4 > 3$)
7 pm (3°C) to 8 pm (2°C) - Fall ($3 > 2$)
8 pm (2°C) to 9 pm (1°C) - Fall ($2 > 1$)
The temperature fell during the hours ending at 11 am, 12 pm, 2 pm, 3 pm, 4 pm, 5 pm, 6 pm, 8 pm, and 9 pm. These can be described as the hour intervals 10 am to 11 am, 11 am to 12 pm, 1 pm to 2 pm, 2 pm to 3 pm, 3 pm to 4 pm, 4 pm to 5 pm, 5 pm to 6 pm, 7 pm to 8 pm, and 8 pm to 9 pm.
(d) What is the change in temperature between 7 am and 10 am?
Temperature at 7 am = 5°C
Temperature at 10 am = 14°C
Change in temperature = Temperature at 10 am - Temperature at 7 am
Change = $14^\circ\text{C} - 5^\circ\text{C} = 9^\circ\text{C}$
The change in temperature between 7 am and 10 am is an increase of 9°C.
(e) During which hour was there a constant temperature?
We need to look for intervals where the temperature remained the same from one reading to the next.
12 pm (10°C) to 1 pm (10°C) - Constant ($10 = 10$)
6 pm (3°C) to 7 pm (3°C) - Constant ($3 = 3$)
There was a constant temperature during the hour intervals 12 pm to 1 pm and 6 pm to 7 pm.
Question 64. The following table gives the growth chart of a child.
| Height (in cm) | 75 | 90 | 110 | 120 | 130 |
|---|---|---|---|---|---|
| Age (in years) | 2 | 4 | 6 | 8 | 10 |
Draw a line graph for the table and answer the questions that follow.
(a) What is the height at the age of 5 years?
(b) How much taller was the child at the age of 10 than at the age of 6?
(c) Between which two consecutive periods did the child grow more faster?
Answer:
We are given a table showing the height of a child at different ages. We need to draw a line graph based on this data and then answer the questions.
Creating the Data Table and Points:
The given table provides pairs of (Age, Height) values. We will use Age as the independent variable (x-axis) and Height as the dependent variable (y-axis).
| Age (in years) (x) | Height (in cm) (y) | Point (x, y) |
| 2 | 75 | (2, 75) |
| 4 | 90 | (4, 90) |
| 6 | 110 | (6, 110) |
| 8 | 120 | (8, 120) |
| 10 | 130 | (10, 130) |
Drawing the Line Graph:
To draw the line graph, follow these steps:
Draw two perpendicular axes on a graph paper. Label the horizontal axis as Age (in years) and the vertical axis as Height (in cm).
The origin is (0,0). Since the data starts from age 2, you might use a zig-zag line on the x-axis near the origin to indicate that the axis is broken, or simply start numbering from 0 and choose a scale that accommodates the data points.
Choose a suitable scale for both axes. For the Age axis, you can use 1 unit per year. For the Height axis, you need to accommodate values from 75 to 130, so a scale like 10 cm per unit, or 5 cm per unit might be suitable, or even 1 unit for every specific value (75, 90, 110, etc.) if the spacing allows.
Plot the points from the table: (2, 75), (4, 90), (6, 110), (8, 120), and (10, 130).
Connect the plotted points with straight line segments. This forms the line graph showing the child's growth over time.
Now, let's answer the questions using the table and the graph.
(a) What is the height at the age of 5 years?
To find the height at the age of 5 years from the graph, locate 5 on the horizontal (Age) axis. This value is between 4 and 6. Move vertically upwards from 5 until you intersect the line segment connecting the points for age 4 and age 6. From that intersection point, move horizontally to the left to the vertical (Height) axis and read the value.
The point for age 4 is (4, 90) and for age 6 is (6, 110). The age 5 is exactly halfway between age 4 and 6. Assuming uniform growth between these ages (as represented by a straight line segment on the graph), the height at age 5 would be the average of the heights at age 4 and 6 if the intervals were equal. However, the ages are 4 and 6 (interval of 2 years), and 5 is in the middle. The height at age 4 is 90 cm, and at age 6 is 110 cm. The increase over 2 years is $110 - 90 = 20$ cm. The average growth rate in this interval is $\frac{20}{2} = 10$ cm/year. At age 5 (1 year after age 4), the height would be $90 + 1 \times 10 = 100$ cm.
From the graph, the height at the age of 5 years is approximately 100 cm.
(b) How much taller was the child at the age of 10 than at the age of 6?
Height at age 10 years = 130 cm (from the table)
Height at age 6 years = 110 cm (from the table)
Difference in height = Height at age 10 - Height at age 6
Difference = $130 \text{ cm} - 110 \text{ cm} = 20 \text{ cm}$.
The child was 20 cm taller at the age of 10 than at the age of 6.
(c) Between which two consecutive periods did the child grow more faster?
Growth rate = $\frac{\text{Change in Height}}{\text{Change in Age}}$. We need to calculate the average growth rate for each interval between consecutive measurements.
- Between Age 2 and 4: Change in Height = $90 - 75 = 15$ cm. Change in Age = $4 - 2 = 2$ years. Growth Rate = $\frac{15}{2} = 7.5$ cm/year.
- Between Age 4 and 6: Change in Height = $110 - 90 = 20$ cm. Change in Age = $6 - 4 = 2$ years. Growth Rate = $\frac{20}{2} = 10$ cm/year.
- Between Age 6 and 8: Change in Height = $120 - 110 = 10$ cm. Change in Age = $8 - 6 = 2$ years. Growth Rate = $\frac{10}{2} = 5$ cm/year.
- Between Age 8 and 10: Change in Height = $130 - 120 = 10$ cm. Change in Age = $10 - 8 = 2$ years. Growth Rate = $\frac{10}{2} = 5$ cm/year.
Comparing the growth rates (7.5, 10, 5, 5 cm/year), the highest growth rate is 10 cm/year.
The child grew faster between the consecutive periods of Age 4 and Age 6.
Question 65. The following is the time-distance graph of Sneha’s walking.

(a) When does Sneha make the least progress? Explain your reasoning.
(b) Find her average speed in km/hour.
Answer:
Let's analyze the given time-distance graph of Sneha's walking.
The graph plots the Distance from the starting point (in km) on the vertical axis against Time (in minutes) on the horizontal axis.
(a) When does Sneha make the least progress? Explain your reasoning.
On a distance-time graph, the progress or distance covered is represented by the change in the vertical axis reading. When the graph line is horizontal, it means that the distance from the starting point is not changing over time.
Observing the graph, the line segment from 9:30 am to 10:30 am is horizontal. During this period, the distance from the starting point remains constant at 2 km.
Therefore, Sneha makes the least progress (zero progress) from 9:30 am to 10:30 am. This indicates that she was stopped or resting during this hour.
(b) Find her average speed in km/hour.
Average speed is calculated as the total distance travelled divided by the total time taken.
Total distance travelled = Final distance from starting point - Initial distance from starting point
The journey starts at 9:00 am with a distance of 0 km.
The journey ends at 11:30 am with a distance of 6 km.
Total distance travelled = $6 \text{ km} - 0 \text{ km} = 6 \text{ km}$.
Total time taken = End time - Start time
Total time taken = 11:30 am - 9:00 am = 2 hours and 30 minutes.
To calculate the average speed in km/hour, we need to convert the total time into hours.
2 hours and 30 minutes = 2 hours + $\frac{30}{60}$ hours = 2 hours + 0.5 hours = 2.5 hours.
Average speed = $\frac{\text{Total Distance}}{\text{Total Time}}$
Average speed = $\frac{6 \text{ km}}{2.5 \text{ hours}}$
Average speed = $\frac{6}{2.5} \text{ km/h} = \frac{60}{25} \text{ km/h} = \frac{\cancel{60}^{12}}{\cancel{25}_5} \text{ km/h} = \frac{12}{5} \text{ km/h}$
Average speed = $2.4 \text{ km/h}$.
Her average speed in km/hour is 2.4 km/h.
Question 66. Draw a parallelogram ABCD on a graph paper with the coordinates given in Table I. Use this table to complete Tables II and III to get the coordinates of E, F, G, H and J, K, L, M.
Table I
| Point | (x,y) |
|---|---|
| A | (1,1) |
| B | (4,4) |
| C | (8,4) |
| D | (5,1) |
Table II
| Point | (0.5x, 0.5y) |
|---|---|
| E | (0.5,0.5) |
| F | |
| G | |
| H |
Table III
| Point | (2x,1.5) |
|---|---|
| J | (2,1.5) |
| K | |
| L | |
| M |
Draw parallelograms EFGH and JKLM on the same graph paper.
Plot the points (2, 4) and (4, 2) on a graph paper, then draw a line segment joining these two points.
Answer:
To Find:
Complete Tables II and III based on the coordinates in Table I and the given transformations. Draw the parallelograms and the line segment on a graph paper.
Solution:
Completing Table II:
The coordinates for Table II are given by $(0.5x, 0.5y)$, where $(x,y)$ are the coordinates from Table I.
For point A(1,1), the coordinates for E are $(0.5 \times 1, 0.5 \times 1) = (0.5, 0.5)$. (Given)
For point B(4,4), the coordinates for F are $(0.5 \times 4, 0.5 \times 4) = (2, 2)$.
For point C(8,4), the coordinates for G are $(0.5 \times 8, 0.5 \times 4) = (4, 2)$.
For point D(5,1), the coordinates for H are $(0.5 \times 5, 0.5 \times 1) = (2.5, 0.5)$.
The completed Table II is:
Table II
| Point | (0.5x, 0.5y) |
|---|---|
| E | (0.5, 0.5) |
| F | (2, 2) |
| G | (4, 2) |
| H | (2.5, 0.5) |
Completing Table III:
The coordinates for Table III are given by $(2x, 1.5)$, where $(x,y)$ are the coordinates from Table I.
For point A(1,1), the coordinates for J are $(2 \times 1, 1.5) = (2, 1.5)$. (Given)
For point B(4,4), the coordinates for K are $(2 \times 4, 1.5) = (8, 1.5)$.
For point C(8,4), the coordinates for L are $(2 \times 8, 1.5) = (16, 1.5)$.
For point D(5,1), the coordinates for M are $(2 \times 5, 1.5) = (10, 1.5)$.
The completed Table III is:
Table III
| Point | (2x, 1.5) |
|---|---|
| J | (2, 1.5) |
| K | (8, 1.5) |
| L | (16, 1.5) |
| M | (10, 1.5) |
Drawing the parallelograms:
On a graph paper, draw the Cartesian plane (x-axis and y-axis).
Plot the points for parallelogram ABCD using Table I:
A(1,1), B(4,4), C(8,4), D(5,1).
Connect the points in order A to B, B to C, C to D, and D to A to form parallelogram ABCD.
Plot the points for parallelogram EFGH using the completed Table II:
E(0.5, 0.5), F(2, 2), G(4, 2), H(2.5, 0.5).
Connect the points in order E to F, F to G, G to H, and H to E to form parallelogram EFGH.
Plot the points for parallelogram JKLM using the completed Table III:
J(2, 1.5), K(8, 1.5), L(16, 1.5), M(10, 1.5).
Connect the points in order J to K, K to L, L to M, and M to J to form parallelogram JKLM.
Plotting points and drawing line segment:
On the same graph paper, plot the point P(2, 4).
Plot the point Q(4, 2).
Draw a line segment joining point P and point Q.
Question 67. Extend the line segment on both sides to meet the coordinate axes. What are the coordinates of the points where this line meets the x -axis and the y-axis?
Answer:
To Find:
The coordinates of the points where the extended line segment joining (2, 4) and (4, 2) meets the x-axis and the y-axis.
Solution:
Let the two given points be P(2, 4) and Q(4, 2).
We need to find the equation of the line passing through these two points.
Using the two-point form of the equation of a line, which is $\frac{y - y_1}{x - x_1} = \frac{y_2 - y_1}{x_2 - x_1}$.
Let $(x_1, y_1) = (2, 4)$ and $(x_2, y_2) = (4, 2)$.
Substitute the coordinates into the formula:
$\frac{y - 4}{x - 2} = \frac{2 - 4}{4 - 2}$
$\frac{y - 4}{x - 2} = \frac{-2}{2}$
$\frac{y - 4}{x - 2} = -1$
Multiply both sides by $(x - 2)$:
$y - 4 = -1(x - 2)$
$y - 4 = -x + 2$
Add 4 to both sides to solve for y:
$y = -x + 2 + 4$
$y = -x + 6$
The equation of the line is $y = -x + 6$ or $x + y = 6$.
To find the point where the line meets the x-axis, we set $y = 0$ in the equation of the line.
$x + 0 = 6$
$x = 6$
The line meets the x-axis at the point with coordinates $(6, 0)$.
To find the point where the line meets the y-axis, we set $x = 0$ in the equation of the line.
$0 + y = 6$
$y = 6$
The line meets the y-axis at the point with coordinates $(0, 6)$.
Answer:
The line meets the x-axis at (6, 0).
The line meets the y-axis at (0, 6).
Question 68. The following graph shows the change in temperature of a block of ice when heated. Use the graph to answer the following questions:
(a) For how many seconds did the ice block have no change in temperature?
(b) For how long was there a change in temperature?
(c) After how many seconds of heating did the temperature become constant at 0°C?
(d) What was the temperature after 25 seconds?
(e) What will be the temperature after 1.5 minutes? Justify your answer.

Answer:
To Use:
The provided graph showing the change in temperature of an ice block when heated.
Solution:
(a) For how many seconds did the ice block have no change in temperature?
From the graph, the temperature of the ice block remained constant at $0^\circ C$ from 15 seconds to 45 seconds.
The duration for which the temperature did not change is $45 \text{ seconds} - 15 \text{ seconds} = 30 \text{ seconds}$.
The ice block had no change in temperature for 30 seconds.
(b) For how long was there a change in temperature?
The temperature changed during the periods from 0 seconds to 15 seconds (from $-10^\circ C$ to $0^\circ C$) and from 45 seconds to 80 seconds (from $0^\circ C$ to $10^\circ C$).
Duration of change in the first period = $15 \text{ s} - 0 \text{ s} = 15 \text{ s}$.
Duration of change in the second period = $80 \text{ s} - 45 \text{ s} = 35 \text{ s}$.
Total duration of change in temperature = $15 \text{ s} + 35 \text{ s} = 50 \text{ s}$.
There was a change in temperature for a total of 50 seconds.
(c) After how many seconds of heating did the temperature become constant at $0^\circ C$?
Looking at the graph, the temperature reaches $0^\circ C$ and starts remaining constant at the point where the curve becomes horizontal. This happens at the 15-second mark.
The temperature became constant at $0^\circ C$ after 15 seconds of heating.
(d) What was the temperature after 25 seconds?
Locate 25 seconds on the x-axis. Move vertically up to the graph line. Then move horizontally to the y-axis to read the temperature.
At 25 seconds, the graph shows the temperature is on the horizontal line at $0^\circ C$.
The temperature after 25 seconds was $0^\circ C$.
(e) What will be the temperature after 1.5 minutes? Justify your answer.
First, convert 1.5 minutes to seconds:
$1.5 \text{ minutes} = 1.5 \times 60 \text{ seconds} = 90 \text{ seconds}$.
The provided graph shows the temperature up to 80 seconds only. To find the temperature at 90 seconds, we need to consider the trend shown in the graph and extrapolate.
From 45 seconds to 80 seconds, the temperature increases linearly from $0^\circ C$ to $10^\circ C$. Let's calculate the rate of temperature increase in this phase:
Rate of change $= \frac{\text{Change in Temperature}}{\text{Change in Time}}$
Rate of change $= \frac{10^\circ C - 0^\circ C}{80 \text{ s} - 45 \text{ s}} = \frac{10^\circ C}{35 \text{ s}} = \frac{2}{7} \text{ }^\circ C/\text{s}$.
Assuming this rate of temperature increase continues beyond 80 seconds, we can predict the temperature at 90 seconds.
Time elapsed from 80 seconds to 90 seconds is $90 \text{ s} - 80 \text{ s} = 10 \text{ s}$.
Increase in temperature in these 10 seconds $= \text{Rate} \times \text{Time} = \frac{2}{7} \text{ }^\circ C/\text{s} \times 10 \text{ s} = \frac{20}{7} \text{ }^\circ C$.
Temperature at 90 seconds = Temperature at 80 seconds + Increase in temperature
Temperature at 90 seconds $= 10^\circ C + \frac{20}{7} \text{ }^\circ C = \frac{70}{7} \text{ }^\circ C + \frac{20}{7} \text{ }^\circ C = \frac{90}{7} \text{ }^\circ C$.
$\frac{90}{7} \approx 12.86^\circ C$.
Justification: The temperature after 1.5 minutes (90 seconds) is estimated by extrapolating the linear increase in temperature observed between 45 seconds and 80 seconds, assuming the heating continues at the same rate.
The temperature after 1.5 minutes (90 seconds) will be approximately $\frac{90}{7}^\circ C$ or about $12.86^\circ C$.
Question 69. The following graph shows the number of people present at a certain shop at different times. Observe the graph and answer the following questions.
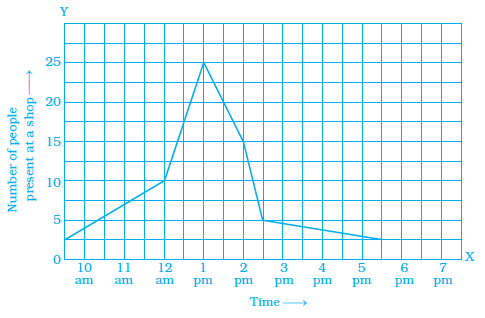
(a) What type of a graph is this?
(b) What information does the graph give?
(c) What is the busiest time of day at the shop?
(d) How many people enter the shop when it opens?
(e) About how many people are there in the shop at 1:30 pm?
Answer:
To Use:
The provided line graph showing the number of people in a shop at different times.
Solution:
Observe the given line graph carefully to answer the questions.
(a) What type of a graph is this?
The graph is formed by connecting plotted points with line segments, showing the variation of the number of people over time.
This is a line graph.
(b) What information does the graph give?
The graph shows the number of people present at a certain shop at different times of the day, specifically from 10 am to 4 pm.
(c) What is the busiest time of day at the shop?
The busiest time corresponds to the point on the graph where the number of people is maximum.
Looking at the graph, the peak occurs at 12 pm (Midday), where the number of people is 50.
The busiest time of day at the shop is 12 pm (Midday).
(d) How many people enter the shop when it opens?
The graph starts the observation at 10 am, which can be considered the opening time shown in the graph.
At 10 am, the graph shows that there are 20 people in the shop.
There are 20 people in the shop when the observation begins at 10 am.
(e) About how many people are there in the shop at 1:30 pm?
1:30 pm is exactly halfway between 1 pm and 2 pm.
At 1 pm, the number of people is 30.
At 2 pm, the number of people is approximately 25.
Assuming a roughly linear change between 1 pm and 2 pm, the number of people at 1:30 pm would be approximately halfway between 30 and 25.
Midpoint value $= \frac{30 + 25}{2} = \frac{55}{2} = 27.5$.
Since the number of people must be an integer, we can estimate it to be approximately 27 or 28.
About 27 or 28 people are there in the shop at 1:30 pm.
Question 70. A man started his journey on his car from location A and came back. The given graph shows his position at different times during the whole journey.
(a) At what time did he start and end his journey?
(b) What was the total duration of journey?
(c) Which journey, forward or return, was of longer duration?
(d) For how many hours did he not move?
(e) At what time did he have the fastest speed?

Answer:
To Use:
The provided distance-time graph showing a car journey from location A and back.
Solution:
Analyze the graph where the x-axis represents time and the y-axis represents the distance from location A.
(a) At what time did he start and end his journey?
The journey starts at the point where time is recorded as 8 am and the distance from A is 0 km (origin).
The journey ends at the point where the distance from A is 0 km again, which occurs at 6 pm.
He started his journey at 8 am and ended it at 6 pm.
(b) What was the total duration of journey?
The total duration of the journey is the difference between the end time and the start time.
Total duration = 6 pm - 8 am
From 8 am to 12 pm is 4 hours.
From 12 pm to 6 pm is 6 hours.
Total duration $= 4 \text{ hours} + 6 \text{ hours} = 10 \text{ hours}$.
The total duration of the journey was 10 hours.
(c) Which journey, forward or return, was of longer duration?
The forward journey is represented by the graph segment where the distance from A increases, which is from 8 am to 12 pm (reaching 100 km).
Duration of forward movement = 12 pm - 8 am = 4 hours.
The return journey is represented by the graph segment where the distance from A decreases, which is from 2 pm (starting from 100 km) to 6 pm (reaching 0 km).
Duration of return movement = 6 pm - 2 pm = 4 hours.
The durations of the forward and return movements were equal.
(d) For how many hours did he not move?
A horizontal line segment on a distance-time graph indicates that the distance is not changing, meaning the object is stationary.
The graph shows a horizontal segment from 12 pm to 2 pm, where the distance remains constant at 100 km.
Duration of stop = 2 pm - 12 pm = 2 hours.
He did not move for 2 hours.
(e) At what time did he have the fastest speed?
The speed of the car is given by the slope of the distance-time graph. A steeper slope indicates a higher speed.
Calculate the speed for each segment where the car is moving:
From 8 am to 12 pm (Forward journey): Speed $= \frac{\text{Change in Distance}}{\text{Change in Time}} = \frac{100 \text{ km} - 0 \text{ km}}{12 \text{ pm} - 8 \text{ am}} = \frac{100}{4} = 25$ km/h.
From 12 pm to 2 pm (Stopped): Speed $= \frac{100 \text{ km} - 100 \text{ km}}{2 \text{ pm} - 12 \text{ pm}} = \frac{0}{2} = 0$ km/h.
From 2 pm to 6 pm (Return journey): Speed $= \frac{0 \text{ km} - 100 \text{ km}}{6 \text{ pm} - 2 \text{ pm}} = \frac{-100}{4} = -25$ km/h. The speed magnitude is $|-25| = 25$ km/h.
The speed is 25 km/h during the forward movement (8 am to 12 pm) and 25 km/h during the return movement (2 pm to 6 pm). The speed is 0 km/h when stopped.
The fastest speed achieved is 25 km/h.
This speed occurred during the time intervals 8 am to 12 pm and 2 pm to 6 pm.
Question 71. The following graph shows the journey made by two cyclists, one from town A to B and the other from town B to A.
(a) At what time did cyclist II rest? How long did the cyclist rest?
(b) Was cyclist II cycling faster or slower after the rest?
(c) At what time did the two cyclists meet?
(d) How far had cyclist II travelled when he met cyclist I?
(e) When cyclist II reached town A, how far was cyclist I from town B?

Answer:
To Use:
The provided distance-time graph showing the journeys of two cyclists between town A and town B.
Solution:
Analyze the graph, where Cyclist I starts from Town A (0 km) and moves towards Town B (80 km), and Cyclist II starts from Town B (80 km) and moves towards Town A (0 km).
(a) At what time did cyclist II rest? How long did the cyclist rest?
Cyclist II's journey is represented by the line starting from the top-left and moving downwards. Resting is indicated by a horizontal line segment, meaning the distance from Town A is not changing.
For Cyclist II, the graph is horizontal from 11 am to 1 pm.
Cyclist II rested from 11 am to 1 pm.
The duration of the rest is $1 \text{ pm} - 11 \text{ am} = 2 \text{ hours}$.
The cyclist rested for 2 hours.
(b) Was cyclist II cycling faster or slower after the rest?
Speed is represented by the slope of the line on a distance-time graph. A steeper slope means faster speed. We compare the steepness of Cyclist II's line before and after the rest period.
Before rest (8 am to 11 am), Cyclist II travelled from 80 km to 20 km (distance changed by 60 km) in 3 hours. Approximate speed = $\frac{60 \text{ km}}{3 \text{ h}} = 20$ km/h.
After rest (1 pm to 4 pm), Cyclist II travelled from 20 km to 0 km (distance changed by 20 km) in 3 hours. Approximate speed = $\frac{20 \text{ km}}{3 \text{ h}} \approx 6.67$ km/h.
Comparing the speeds, 20 km/h is greater than $\approx 6.67$ km/h.
Cyclist II was cycling slower after the rest.
(c) At what time did the two cyclists meet?
The cyclists meet at the point where their paths intersect on the graph. The intersection point occurs where the line for Cyclist I crosses the line for Cyclist II.
The intersection point is at 10 am.
The two cyclists met at 10 am.
(d) How far had cyclist II travelled when he met cyclist I?
The meeting point is at 10 am. At 10 am, the intersection point is at a distance of 40 km from Town A.
Cyclist II started from Town B, which is 80 km away from Town A. When they met, Cyclist II was 40 km away from Town A.
The distance travelled by Cyclist II is the initial distance from A minus the final distance from A: $80 \text{ km} - 40 \text{ km} = 40 \text{ km}$.
Cyclist II had travelled 40 km when he met cyclist I.
(e) When cyclist II reached town A, how far was cyclist I from town B?
Cyclist II reached Town A when his distance from Town A is 0 km. This occurs at 4 pm on the graph.
At 4 pm, find the position of Cyclist I on the graph. At 4 pm, Cyclist I is at a distance of 60 km from Town A.
Town B is 80 km away from Town A. The distance of Cyclist I from Town B is the total distance between A and B minus Cyclist I's distance from A.
Distance of Cyclist I from Town B $= 80 \text{ km} - 60 \text{ km} = 20 \text{ km}$.
When cyclist II reached town A, cyclist I was 20 km from town B.
Question 72. Ajita starts off from home at 07.00 hours with her father on a scooter that goes at a uniform speed of 30 km/h and drops her at her school after half an hour. She stays in the school till 13.30 hours and takes an auto rickshaw to return home. The rickshaw has a uniform speed of 10 km/h. Draw the graph for the above situation and also determine the distance of Ajita’s school from her house.
Answer:
To Find:
Draw the distance-time graph for Ajita's journey and determine the distance of her school from her house.
Solution:
First, let's calculate the distance of Ajita's school from her house.
She travels to school by scooter at a uniform speed of 30 km/h for half an hour.
Time taken $= \text{half an hour} = 30 \text{ minutes}$.
Convert time to hours: $30 \text{ minutes} = \frac{30}{60} \text{ hours} = 0.5 \text{ hours}$.
Using the formula: $\text{Distance} = \text{Speed} \times \text{Time}$.
Distance to school $= 30 \text{ km/h} \times 0.5 \text{ h} = 15 \text{ km}$.
The distance of Ajita's school from her house is 15 km.
Now, let's determine the timings for different parts of the journey to prepare for the graph.
Journey to school:
Starts from home at 07:00 hours.
Reaches school after 30 minutes (0.5 hours) at $07:00 + 00:30 = 07:30$ hours.
Distance from home at 07:00 is 0 km.
Distance from home at 07:30 is 15 km.
This part of the journey is represented by a line segment on the graph from the point $(07:00, 0)$ to $(07:30, 15)$.
Stay at school:
Stays in school from 07:30 hours till 13:30 hours.
During this time, the distance from home remains constant at 15 km.
This part of the situation is represented by a horizontal line segment on the graph from the point $(07:30, 15)$ to $(13:30, 15)$.
Return journey home:
Starts from school at 13:30 hours by auto rickshaw at a uniform speed of 10 km/h.
Distance to travel back home is 15 km.
Time taken for return journey $= \frac{\text{Distance}}{\text{Speed}} = \frac{15 \text{ km}}{10 \text{ km/h}} = 1.5 \text{ hours}$.
$1.5 \text{ hours} = 1 \text{ hour and } 30 \text{ minutes}$.
Reaches home at $13:30 + 01:30 = 15:00$ hours (or 3:00 pm).
Distance from home at 13:30 is 15 km.
Distance from home at 15:00 is 0 km.
This part of the journey is represented by a line segment on the graph from the point $(13:30, 15)$ to $(15:00, 0)$.
Data points for the graph:
| Time (hours) | Distance from Home (km) | Point (Time, Distance) |
| 07:00 | 0 | (07:00, 0) |
| 07:30 | 15 | (07:30, 15) |
| 13:30 | 15 | (13:30, 15) |
| 15:00 | 0 | (15:00, 0) |
Drawing the graph:
Draw the x-axis representing time in hours and the y-axis representing distance from home in km.
Label the x-axis with time points starting from 07:00 and extending up to 15:00 (e.g., 07:00, 08:00, 09:00, ..., 15:00).
Label the y-axis with distance points from 0 km up to at least 15 km (e.g., 0, 5, 10, 15, 20 km).
Plot the points calculated above:
- (07:00, 0)
- (07:30, 15)
- (13:30, 15)
- (15:00, 0)
Join the points with line segments:
- Draw a line segment from (07:00, 0) to (07:30, 15). This represents the journey to school. The slope of this line is positive, indicating increasing distance from home.
- Draw a horizontal line segment from (07:30, 15) to (13:30, 15). This represents the time spent at school. The slope is zero, indicating no change in distance from home.
- Draw a line segment from (13:30, 15) to (15:00, 0). This represents the journey back home. The slope is negative, indicating decreasing distance from home.
This completes the distance-time graph for Ajita's journey.
Question 73. Draw the line graph using suitable scale to show the annual gross profit of a company for a period of five years.
| Year | 1st | 2nd | 3rd | 4th | 5th |
|---|---|---|---|---|---|
| Gross Profit (in Rs) | 17,00,000 | 15,50,000 | 11,40,000 | 12,10,000 | 14,90,000 |
Answer:
To Draw:
A line graph showing the annual gross profit of a company for a period of five years using the given data.
Solution:
To draw the line graph, follow these steps:
1. Draw the Axes: Draw two perpendicular lines on the graph paper. The horizontal axis (x-axis) will represent the Year, and the vertical axis (y-axis) will represent the Gross Profit (in $\textsf{₹}$).
2. Choose a Scale:
For the x-axis, mark the years 1st, 2nd, 3rd, 4th, and 5th at equal intervals along the horizontal axis.
For the y-axis, the gross profit values range from $\textsf{₹} 11,40,000$ to $\textsf{₹} 17,00,000$. We can choose a scale where each unit on the y-axis represents a certain value, for example, $\textsf{₹} 1,00,000$ or $\textsf{₹} 2,00,000$. Since the lowest value is above 10,00,000, we can use a broken axis near the origin on the y-axis if starting from 0, or start the y-axis scaling from a suitable value like $\textsf{₹} 10,00,000$. Let's use a scale where 1 unit on the y-axis represents $\textsf{₹} 1,00,000$, starting the scale from $\textsf{₹} 10,00,000$ (using a broken axis below that if drawn from 0).
Label the y-axis clearly as "Gross Profit (in $\textsf{₹}$)" and mark the values according to the chosen scale (e.g., 10,00,000, 11,00,000, 12,00,000, ..., 17,00,000, 18,00,000).
3. Plot the Points: Plot the points on the graph paper corresponding to the data in the table. The coordinates of the points will be (Year, Gross Profit).
- For the 1st Year, plot the point (1st, $\textsf{₹} 17,00,000$).
- For the 2nd Year, plot the point (2nd, $\textsf{₹} 15,50,000$). This will be halfway between $\textsf{₹} 15,00,000$ and $\textsf{₹} 16,00,000$ on the y-axis relative to Year 2 on the x-axis.
- For the 3rd Year, plot the point (3rd, $\textsf{₹} 11,40,000$). This will be slightly above $\textsf{₹} 11,00,000$ on the y-axis relative to Year 3 on the x-axis.
- For the 4th Year, plot the point (4th, $\textsf{₹} 12,10,000$). This will be slightly above $\textsf{₹} 12,00,000$ on the y-axis relative to Year 4 on the x-axis.
- For the 5th Year, plot the point (5th, $\textsf{₹} 14,90,000$). This will be slightly below $\textsf{₹} 15,00,000$ on the y-axis relative to Year 5 on the x-axis.
4. Join the Points: Connect the plotted points with line segments in the order of the years (from 1st to 2nd, 2nd to 3rd, 3rd to 4th, and 4th to 5th).
5. Add Labels and Title: Add labels to the x-axis and y-axis and give the graph a suitable title, such as "Annual Gross Profit of the Company".
Question 74. The following chart gives the growth in height in terms of percentage of full height of boys and girls with their respective ages.
| Age (in years) | 8 | 9 | 10 | 11 | 12 | 13 | 14 | 15 | 16 | 17 | 18 |
|---|---|---|---|---|---|---|---|---|---|---|---|
| Boys | 72% | 75% | 78% | 81% | 84% | 88% | 92% | 95% | 98% | 99% | 100% |
| Girls | 77% | 81% | 84% | 88% | 91% | 95% | 98% | 99% | 99.5% | 100% | 100% |
Draw the line graph of above data on the same sheet and answer the following questions.
(a) In which year both the boys and the girls achieve their maximum height?
(b) Who grows faster at puberty (14 years to 16 years of age)?
Answer:
To Use:
The provided table showing the percentage of full height for boys and girls at different ages.
To Draw:
A line graph representing the data for boys and girls on the same sheet.
To Answer:
(a) In which year both the boys and the girls achieve their maximum height?
(b) Who grows faster at puberty (14 years to 16 years of age)?
Solution:
Drawing the line graph:
1. Draw the x-axis and y-axis. Label the x-axis as 'Age (in years)' and the y-axis as 'Percentage of Full Height'.
2. Choose a scale for the x-axis to accommodate ages from 8 to 18 years at equal intervals.
3. Choose a suitable scale for the y-axis to accommodate percentages from around 70% to 100%. You can start the scale from 70% or use a broken axis if starting from 0%. Let's assume a scale where 1 unit represents 2% or 5% height.
4. Plot the points for 'Boys' based on the table: (8, 72), (9, 75), (10, 78), (11, 81), (12, 84), (13, 88), (14, 92), (15, 95), (16, 98), (17, 99), (18, 100).
5. Plot the points for 'Girls' based on the table: (8, 77), (9, 81), (10, 84), (11, 88), (12, 91), (13, 95), (14, 98), (15, 99), (16, 99.5), (17, 100), (18, 100).
6. Connect the points for 'Boys' with line segments to form the line graph for boys. Use a distinct color or line style (e.g., blue line).
7. Connect the points for 'Girls' with line segments to form the line graph for girls. Use a different distinct color or line style (e.g., red line).
8. Add a legend to distinguish between the lines for boys and girls.
9. Give the graph a suitable title, such as "Percentage of Full Height vs. Age".
Answering the questions:
(a) In which year both the boys and the girls achieve their maximum height?
Maximum height corresponds to 100% of full height.
From the table, boys reach 100% height at 18 years.
From the table, girls reach 100% height at 17 years. Girls remain at 100% at 18 years as well.
The question asks for the year when both achieve their maximum height. This means the earliest age at which both lines reach or stay at the 100% mark.
Both boys and girls are at 100% height at the age of 18 years.
(b) Who grows faster at puberty (14 years to 16 years of age)?
To determine who grows faster, we look at the increase in percentage of full height for both boys and girls from age 14 to age 16.
For boys, at age 14, the height is 92%. At age 16, the height is 98%.
Increase in height percentage for boys = $98\% - 92\% = 6\%$.
For girls, at age 14, the height is 98%. At age 16, the height is 99.5%.
Increase in height percentage for girls = $99.5\% - 98\% = 1.5\%$.
Comparing the increases: $6\%$ (boys) is greater than $1.5\%$ (girls).
Therefore, boys grow faster at puberty (from 14 years to 16 years of age).
Question 75. The table shows the data collected for Dhruv’s walking on a road.
| Time (in minutes) | 0 | 5 | 10 | 15 | 20 | 25 |
|---|---|---|---|---|---|---|
| Distance (in km) | 0 | 0.5 | 1 | 1.25 | 1.5 | 1.75 |
(a) Plot a line graph for the given data using a suitable scale.
(b) In what time periods did Dhruv make the most progress?
Answer:
To Plot and Find:
Plot a line graph for the given time-distance data and determine the time periods of most progress.
Solution:
(a) Plotting the line graph:
1. Draw two perpendicular axes, the horizontal axis (x-axis) representing Time (in minutes) and the vertical axis (y-axis) representing Distance (in km).
2. Choose a suitable scale for each axis. For the x-axis (Time), you can mark points at intervals of 5 minutes (0, 5, 10, 15, 20, 25). For the y-axis (Distance), you can mark points at intervals of 0.25 km or 0.5 km, ensuring the scale goes up to at least 1.75 km (e.g., 0, 0.25, 0.5, 0.75, 1.0, 1.25, 1.5, 1.75, 2.0).
3. Plot the points corresponding to the data from the table on the graph paper. The points are (Time, Distance):
- (0, 0)
- (5, 0.5)
- (10, 1)
- (15, 1.25)
- (20, 1.5)
- (25, 1.75)
4. Connect the plotted points with line segments in order (from the first point to the second, the second to the third, and so on) to form the line graph.
5. Add a title to the graph, such as "Dhruv's Walking Journey".
(b) Determining the time periods of most progress:
Progress can be considered as the distance covered in each time interval. We need to calculate the distance covered in each 5-minute interval shown in the table.
- From 0 to 5 minutes: Distance covered = $0.5 \text{ km} - 0 \text{ km} = 0.5 \text{ km}$.
- From 5 to 10 minutes: Distance covered = $1 \text{ km} - 0.5 \text{ km} = 0.5 \text{ km}$.
- From 10 to 15 minutes: Distance covered = $1.25 \text{ km} - 1 \text{ km} = 0.25 \text{ km}$.
- From 15 to 20 minutes: Distance covered = $1.5 \text{ km} - 1.25 \text{ km} = 0.25 \text{ km}$.
- From 20 to 25 minutes: Distance covered = $1.75 \text{ km} - 1.5 \text{ km} = 0.25 \text{ km}$.
Comparing the distances covered in each interval, the largest distance covered in a 5-minute period is 0.5 km.
This occurred during the intervals 0 to 5 minutes and 5 to 10 minutes.
The most progress was made in the time periods 0 to 5 minutes and 5 to 10 minutes.
Question 76. Observe the given graph carefully and complete the table given below.
| x | 1 | 2 | 3 | 4 | 5 |
|---|---|---|---|---|---|
| y |
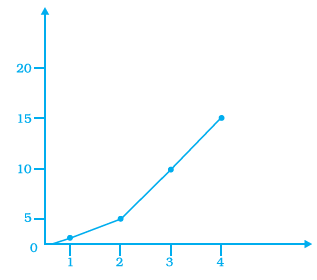
Answer:
To Use:
The provided line graph.
To Complete:
The given table using the data from the graph.
Solution:
Observe the graph and find the y-coordinate for each given x-coordinate listed in the table.
- When $x = 1$, the point on the graph is $(1, 2)$. So, $y = 2$.
- When $x = 2$, the point on the graph is $(2, 4)$. So, $y = 4$.
- When $x = 3$, the point on the graph is $(3, 6)$. So, $y = 6$.
- When $x = 4$, the point on the graph is $(4, 8)$. So, $y = 8$.
- When $x = 5$, the point on the graph is $(5, 10)$. So, $y = 10$.
Fill these y-values into the table.
The completed table is:
| x | 1 | 2 | 3 | 4 | 5 |
|---|---|---|---|---|---|
| y | 2 | 4 | 6 | 8 | 10 |
Question 77. This graph shows the per cent of students who dropped out of school after completing High School. The point labelled A shows that, in 1996, about 4.7% of students dropped out.
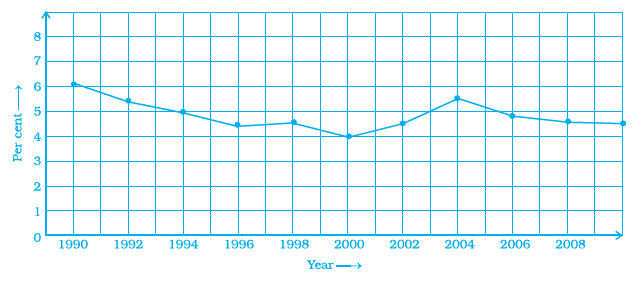
(a) In which year was the dropout the rate highest? In which year was it the lowest?
(b) When did the per cent of students who dropped out of high school first fall below 5%?
(c) About what per cent of students dropped out of high school in 2007? About what per cent of students stayed in high school in 2008?
Answer:
To Use:
The provided line graph showing the percentage of students who dropped out of school after completing High School.
Solution:
Observe the graph carefully to find the required information.
(a) In which year was the dropout the rate highest? In which year was it the lowest?
The highest dropout rate corresponds to the highest point on the graph. This occurs in the year 1998, with a rate of 5.3%.
The lowest dropout rate corresponds to the lowest point on the graph. This occurs in the year 2006, with a rate of 3.5%.
The dropout rate was highest in 1998 and lowest in 2006.
(b) When did the per cent of students who dropped out of high school first fall below 5%?
Look at the graph points and their corresponding percentages:
- 1996: 4.7% (already below 5%)
- 1997: 5.1% (above 5%)
- 1998: 5.3% (above 5%)
- 1999: 5.2% (above 5%)
- 2000: 4.9% (below 5%)
Starting from a period where the rate was above 5% (from 1997 to 1999), the rate first fell below 5% in the year 2000.
(c) About what per cent of students dropped out of high school in 2007? About what per cent of students stayed in high school in 2008?
In the year 2007, find the point on the graph corresponding to 2007. The dropout rate is 3.6%.
About 3.6% of students dropped out of high school in 2007.
In the year 2008, find the point on the graph corresponding to 2008. The dropout rate is 4.1%.
The percentage of students who stayed in high school is $100\%$ minus the percentage who dropped out.
Percentage of students who stayed in 2008 $= 100\% - 4.1\% = 95.9\%$.
About 95.9% of students stayed in high school in 2008.
Question 78. Observe the toothpick pattern given below:

(a) Imagine that this pattern continues. Complete the table to show the number of toothpicks in the first six terms.
| Pattern | 1 | 2 | 3 | 4 | 5 | 6 |
|---|---|---|---|---|---|---|
| Toothpicks | 4 | 13 |
(b) Make a graph by taking the pattern numbers on the horizontal axis and the number of toothpicks on the vertical axis. Make the horizontal axis from 0 to 10 and the vertical axis from 0 to 30.
(c) Use your graph to predict the number of toothpicks in patterns 7 and 8. Check your answers by actually drawing them.
(d) Would it make sense to join the points on this graph? Explain.
Answer:
Given:
A toothpick pattern and a partial table showing the number of toothpicks for the first few patterns.
To Find:
(a) Complete the table.
(b) Draw a line graph of the data.
(c) Use the graph/pattern to predict the number of toothpicks in patterns 7 and 8 and verify.
(d) Explain if joining the points on the graph makes sense.
Solution:
(a) Completing the table:
Observe the pattern:
- Pattern 1 has 4 toothpicks.
- Pattern 2 appears to add 3 toothpicks to Pattern 1 ($4 + 3 = 7$).
- Pattern 3 appears to add 3 toothpicks to Pattern 2 ($7 + 3 = 10$).
- Pattern 4 is given as 13, which follows the pattern ($10 + 3 = 13$).
The number of toothpicks increases by 3 for each subsequent pattern. This suggests a linear relationship. Let $n$ be the pattern number and $N$ be the number of toothpicks. The relationship is of the form $N = an + b$.
Using the first term (n=1, N=4): $4 = a(1) + b \Rightarrow a + b = 4$.
Since the difference between consecutive terms is 3, the coefficient 'a' (slope) is 3. So, $a=3$.
Substitute $a=3$ into the equation: $3 + b = 4 \Rightarrow b = 1$.
The formula for the number of toothpicks is $N = 3n + 1$.
Using this formula, we can complete the table:
- For Pattern 1 ($n=1$): $N = 3(1) + 1 = 4$ (Given)
- For Pattern 2 ($n=2$): $N = 3(2) + 1 = 7$
- For Pattern 3 ($n=3$): $N = 3(3) + 1 = 10$
- For Pattern 4 ($n=4$): $N = 3(4) + 1 = 13$ (Given)
- For Pattern 5 ($n=5$): $N = 3(5) + 1 = 16$
- For Pattern 6 ($n=6$): $N = 3(6) + 1 = 19$
The completed table is:
| Pattern | 1 | 2 | 3 | 4 | 5 | 6 |
|---|---|---|---|---|---|---|
| Toothpicks | 4 | 7 | 10 | 13 | 16 | 19 |
(b) Drawing the graph:
1. Draw the x-axis (horizontal) and y-axis (vertical) on graph paper.
2. Label the x-axis as 'Pattern Number' and scale it from 0 to 10 at equal intervals.
3. Label the y-axis as 'Number of Toothpicks' and scale it from 0 to 30. A suitable interval might be every 2 or 3 units.
4. Plot the points from the completed table: (1, 4), (2, 7), (3, 10), (4, 13), (5, 16), (6, 19).
5. Connect these plotted points with line segments.
6. Add a title, e.g., "Toothpick Pattern Growth".
(c) Prediction for patterns 7 and 8:
Based on the linear relationship observed and plotted, we can extend the line (or use the formula $N = 3n + 1$) to predict the number of toothpicks for patterns 7 and 8.
Using the formula:
For Pattern 7 ($n=7$): $N = 3(7) + 1 = 21 + 1 = 22$.
For Pattern 8 ($n=8$): $N = 3(8) + 1 = 24 + 1 = 25$.
Using the graph: If the line is drawn, locate Pattern Number 7 on the x-axis, move vertically up to the line, and then horizontally to the y-axis to read the number of toothpicks (it should be 22). Similarly, for Pattern Number 8, read the value 25 on the y-axis.
Prediction for pattern 7: 22 toothpicks.
Prediction for pattern 8: 25 toothpicks.
Verification by drawing:
Pattern 7 would be Pattern 6 plus another square sharing a side, adding 3 toothpicks: $19 + 3 = 22$.
Pattern 8 would be Pattern 7 plus another square sharing a side, adding 3 toothpicks: $22 + 3 = 25$.
The predictions match the pattern observed by drawing.
(d) Meaning of joining the points:
Joining the points on this graph implies a continuous relationship between the pattern number and the number of toothpicks. However, the pattern number ($n$) represents a discrete count (1st, 2nd, 3rd, ...). There is no "1.5th" pattern or "3.75th" pattern in this context, and you cannot have a fractional number of toothpicks.
Therefore, strictly speaking, it does not make sense to join the points if the graph is meant to represent only the specific patterns shown. The graph is a plot of discrete data points. However, joining the points is often done in line graphs to visualize the trend (which is linear in this case) and to make predictions for subsequent integer pattern numbers, which is what was done in part (c).
Question 79. Consider this input/output table.
| Input | 1 | 2 | 4 | 5 | 7 |
|---|---|---|---|---|---|
| Output | 2 | 5 | 11 | 14 | 20 |
(a) Graph the values from the table by taking Input along horizontal axis from 0 to 8 and Output along vertical axis from 0 to 24.
(b) Use your graph to predict the outputs for inputs of 3 and 8.
Answer:
To Plot and Predict:
Plot a line graph for the given input/output data and use the graph to predict outputs for inputs of 3 and 8.
Solution:
(a) Graphing the values:
1. Draw two perpendicular axes on graph paper. The horizontal axis (x-axis) represents the Input, and the vertical axis (y-axis) represents the Output.
2. Choose a suitable scale for each axis. According to the instructions, scale the horizontal axis from 0 to 8 and the vertical axis from 0 to 24.
3. Label the axes clearly as 'Input' (x-axis) and 'Output' (y-axis).
4. Plot the points from the table on the graph paper. The points are (Input, Output):
- (1, 2)
- (2, 5)
- (4, 11)
- (5, 14)
- (7, 20)
5. Connect the plotted points with line segments. Since the points appear to lie on a straight line (as verified by the constant rate of change in the thought process), the graph will be a single straight line.
6. Add a title to the graph, e.g., "Input/Output Relationship".
(b) Predicting the outputs:
To predict the outputs for inputs of 3 and 8 using the graph, locate the Input value on the horizontal axis, move vertically up to the line drawn, and then move horizontally to the vertical axis to read the corresponding Output value.
Alternatively, the pattern in the table shows a constant increase in Output for a unit increase in Input (e.g., from Input 1 to 2, Output increases by 3; from Input 4 to 5, Output increases by 3). The relationship is linear, with the rule Output $= 3 \times \text{Input} - 1$.
Using the graph or the relationship:
- For Input = 3: Locate 3 on the Input axis. Move up to the line and across to the Output axis. The value should be 8. Using the formula: Output $= 3(3) - 1 = 9 - 1 = 8$.
- For Input = 8: Locate 8 on the Input axis. Move up to the extended line and across to the Output axis. The value should be 23. Using the formula: Output $= 3(8) - 1 = 24 - 1 = 23$.
The predicted output for Input = 3 is 8.
The predicted output for Input = 8 is 23.
Question 80. This graph shows a map of an island just off the coast of a continent. The point labelled B represents a major city on the coast. The distance between grid lines represents 1 km.

Point A represents a resort that is located 5 km East and 3 km North of Point B. The values 5 and 3 are the coordinates of Point A. The coordinates can be given as the ordered pair (5, 3), where 5 is the horizontal coordinate and 3 is the vertical coordinate.
(i) On a copy of the map, mark the point that is 3 km East and 5 km North of Point B and label it S. Is Point S in the water or on the island? Is Point S in the same place as Point A?
(ii) Mark the point that is 7 km east and 5 km north of Point B and label it C. Then mark the point that is 5 km east and 7 km north of Point B and label it D. Are Points C and D in the same place? Give the coordinates of Points C and D.
(iii) Which point is in the water, (2, 7) or (7, 2)? Mark the point which is in water on your map and label it E.
(iv) Give the coordinates of two points on the island that are exactly 2 km from Point A.
(v) Give the coordinates of the point that is halfway between Points L and P.
(vi) List three points on the island with their x-coordinates greater than 8.
(vii) List three points on the island with a y-coordinate less than 4.
Answer:
To Use:
The provided map of an island and a major city B, with grid lines representing 1 km.
Solution:
We consider Point B as the origin (0, 0) of the coordinate system, where East is along the positive x-axis and North is along the positive y-axis.
(i) Mark the point that is 3 km East and 5 km North of Point B and label it S. Is Point S in the water or on the island? Is Point S in the same place as Point A?
A point 3 km East and 5 km North of B(0, 0) has coordinates $(0+3, 0+5) = (3, 5)$. So, Point S is at (3, 5).
Looking at the map, the grid point (3, 5) is located within the boundaries of the island.
Point A is given to be at (5, 3).
Since the coordinates of Point S (3, 5) are different from the coordinates of Point A (5, 3), Point S is not in the same place as Point A.
Point S is on the island.
Point S is not in the same place as Point A.
(ii) Mark the point that is 7 km east and 5 km north of Point B and label it C. Then mark the point that is 5 km east and 7 km north of Point B and label it D. Are Points C and D in the same place? Give the coordinates of Points C and D.
Point C is 7 km East and 5 km North of B(0, 0). Its coordinates are $(0+7, 0+5) = (7, 5)$. So, Point C is at (7, 5).
Point D is 5 km East and 7 km North of B(0, 0). Its coordinates are $(0+5, 0+7) = (5, 7)$. So, Point D is at (5, 7).
Since the coordinates of Point C (7, 5) are different from the coordinates of Point D (5, 7), Points C and D are not in the same place.
Points C and D are not in the same place.
The coordinates of Point C are (7, 5).
The coordinates of Point D are (5, 7).
(iii) Which point is in the water, (2, 7) or (7, 2)? Mark the point which is in water on your map and label it E.
Look at the map grid:
Point (2, 7) is 2 km East and 7 km North of B. On the map, this location appears to be outside the boundary of the island, i.e., in the water.
Point (7, 2) is 7 km East and 2 km North of B. On the map, this location appears to be inside the boundary of the island.
The point which is in the water is (2, 7).
Label the point (2, 7) as E on the map (as instructed, although this cannot be physically done in the text output).
(iv) Give the coordinates of two points on the island that are exactly 2 km from Point A.
Point A is at (5, 3).
We are looking for points (x, y) on the island such that the distance from (x, y) to (5, 3) is 2 km.
The points at integer coordinates that are 2 km away from (5, 3) are those for which $(x-5)^2 + (y-3)^2 = 2^2 = 4$.
Possible integer coordinate points 2 km away are:
- (5+2, 3) = (7, 3)
- (5-2, 3) = (3, 3)
- (5, 3+2) = (5, 5)
- (5, 3-2) = (5, 1)
Checking these points on the map to see if they are on the island:
- (7, 3): Appears to be on the island.
- (3, 3): Appears to be on the island.
- (5, 5): Appears to be on the island. (This was S from part (i) but incorrectly defined there; its correct coordinate is (3,5))
- (5, 1): Appears to be on the island.
We need to provide two such points. Let's choose (7, 3) and (3, 3).
(v) Give the coordinates of the point that is halfway between Points L and P.
Locate Points L and P on the map and estimate their coordinates based on the grid:
Point L appears to be at (1, 7).
Point P appears to be at (9, 7).
Using the midpoint formula $\left(\frac{x_1 + x_2}{2}, \frac{y_1 + y_2}{2}\right)$ for points (1, 7) and (9, 7):
Midpoint $= \left(\frac{1 + 9}{2}, \frac{7 + 7}{2}\right) = \left(\frac{10}{2}, \frac{14}{2}\right) = (5, 7)$.
The point halfway between Points L and P is at (5, 7).
(vi) List three points on the island with their x-coordinates greater than 8.
Look at the part of the island where the x-coordinate is 9 or more. Examples of integer coordinate points on the island in this region are:
- (9, 7) - This is Point P.
- (9, 6)
- (9, 5)
- (10, 6)
- (10, 5)
- (11, 5)
Three points on the island with x-coordinates greater than 8 are (9, 7), (9, 6), and (10, 5) (other valid points are possible).
(vii) List three points on the island with a y-coordinate less than 4.
Look at the part of the island where the y-coordinate is 3 or less. Examples of integer coordinate points on the island in this region are:
- (5, 3) - This is Point A.
- (7, 3)
- (3, 3)
- (5, 1)
- (7, 2)
- (4, 1)
Three points on the island with a y-coordinate less than 4 are (5, 3), (7, 2), and (4, 1) (other valid points are possible).
Question 81. As part of his science project, Prithvi was supposed to record the temperature every hour one Saturday from 6 am to midnight. At noon, he was taking lunch and forgot to record the temperature. At 8:00 pm, his favourite show came on and so forgot again. He recorded the data so collected on a graph sheet as shown below.

(a) Why does it make sense to connect the points in this situation?
(b) Describe the overall trend, or pattern, in the way the temperature changes over the time period shown on the graph.
(c) Estimate the temperature at noon and 8 pm.
Answer:
To Use:
The provided line graph showing temperature change over time.
Solution:
Analyze the given graph where the horizontal axis represents time and the vertical axis represents temperature in degrees Celsius ($^\circ C$).
(a) Why does it make sense to connect the points in this situation?
It makes sense to connect the points in this situation because temperature is a continuous variable. The temperature does not jump instantly from one value to another but changes gradually over time. The line segments between the plotted points provide a reasonable estimation of the temperature at times between the recorded points, showing the trend of temperature change.
(b) Describe the overall trend, or pattern, in the way the temperature changes over the time period shown on the graph.
The overall trend shown in the graph is that the temperature starts relatively low in the morning (6 am), rises throughout the morning and early afternoon, reaches a peak (maximum temperature) in the mid-afternoon (around 3 pm), and then gradually decreases through the evening towards midnight.
Specifically, the temperature increases from $10^\circ C$ at 6 am to $28^\circ C$ at 3 pm, and then decreases to $10^\circ C$ by midnight.
(c) Estimate the temperature at noon and 8 pm.
Noon corresponds to 12:00 on the time axis.
Locate 12:00 on the x-axis. Move vertically up to the line graph, and then horizontally to the y-axis to estimate the temperature.
The point for 12:00 lies on the line segment between the point at 11:00 (approximately $22.5^\circ C$) and the point at 13:00 ($25^\circ C$). 12:00 is halfway between 11:00 and 13:00. Assuming a linear change between these points, the temperature at 12:00 is approximately the average of the temperatures at 11:00 and 13:00.
Estimated temperature at 11:00 is approximately halfway between 20 and 25, which is $22.5^\circ C$.
Estimated temperature at 12:00 $\approx \frac{22.5^\circ C + 25^\circ C}{2} = \frac{47.5^\circ C}{2} = 23.75^\circ C$.
8 pm corresponds to 20:00 on the time axis.
Locate 20:00 on the x-axis. Move vertically up to the line graph, and then horizontally to the y-axis to estimate the temperature.
The point for 20:00 lies on the line segment between the point at 19:00 (approximately $20.5^\circ C$) and the point at 21:00 ($15^\circ C$). 20:00 is halfway between 19:00 and 21:00. Assuming a linear change between these points, the temperature at 20:00 is approximately the average of the temperatures at 19:00 and 21:00.
Estimated temperature at 19:00 is approximately halfway between 20 and 21, which is $20.5^\circ C$.
Estimated temperature at 20:00 $\approx \frac{20.5^\circ C + 15^\circ C}{2} = \frac{35.5^\circ C}{2} = 17.75^\circ C$.
Estimated temperature at noon (12:00) is about $23.75^\circ C$.
Estimated temperature at 8 pm (20:00) is about $17.75^\circ C$.
Question 82. The graph given below compares the price (in Rs) and weight of 6 bags (in kg) of sugar of different brands A, B, C, D, E, F.

(a) Which brand(s) costs/cost more than Brand D?
(b) Bag of which brand of sugar is the heaviest?
(c) Which brands weigh the same?
(d) Which brands are heavier than brand B?
(e) Which bag is the lightest?
(f) Which bags are of the same price?
Answer:
To Use:
The provided scatter plot graph showing the price and weight of 6 bags of sugar of different brands.
Solution:
We read the approximate coordinates (Weight in kg, Price in $\textsf{₹}$) for each brand from the graph:
- Brand A: (2, 60)
- Brand B: (3, 75)
- Brand C: (5, 80)
- Brand D: (4, 65)
- Brand E: (4, 80)
- Brand F: (3, 60)
(a) Which brand(s) costs/cost more than Brand D?
Price of Brand D is $\textsf{₹} 65$. We look for brands with a price greater than $\textsf{₹} 65$.
- Brand B: $\textsf{₹} 75 > \textsf{₹} 65$
- Brand C: $\textsf{₹} 80 > \textsf{₹} 65$
- Brand E: $\textsf{₹} 80 > \textsf{₹} 65$
Brands B, C, and E cost more than Brand D.
Answer: Brands B, C, and E.
(b) Bag of which brand of sugar is the heaviest?
The heaviest bag has the largest weight (x-coordinate).
- Brand A: 2 kg
- Brand B: 3 kg
- Brand C: 5 kg
- Brand D: 4 kg
- Brand E: 4 kg
- Brand F: 3 kg
The largest weight is 5 kg, which corresponds to Brand C.
Answer: Brand C.
(c) Which brands weigh the same?
We look for brands with the same weight (x-coordinate).
- Brands D and E both weigh 4 kg.
- Brands B and F both weigh 3 kg.
Answer: Brands D and E weigh the same. Also, Brands B and F weigh the same.
(d) Which brands are heavier than brand B?
Weight of Brand B is 3 kg. We look for brands with weight greater than 3 kg.
- Brand C: 5 kg > 3 kg
- Brand D: 4 kg > 3 kg
- Brand E: 4 kg > 3 kg
Brands C, D, and E are heavier than Brand B.
Answer: Brands C, D, and E.
(e) Which bag is the lightest?
The lightest bag has the smallest weight (x-coordinate).
- Brand A: 2 kg
The smallest weight is 2 kg, which corresponds to Brand A.
Answer: Brand A.
(f) Which bags are of the same price?
We look for brands with the same price (y-coordinate).
- Brands A and F both cost $\textsf{₹} 60$.
- Brands C and E both cost $\textsf{₹} 80$.
Answer: Brands A and F are of the same price. Also, Brands C and E are of the same price.
Question 83. The points on the graph below represent the height and weight of the donkey, dog, crocodile, and ostrich shown in the drawing.

(a) What are the two variables represented in the graph?
(b) Which point represents each animals? Explain.
Answer:
To Use:
The provided graph and drawing showing the height and weight of four animals.
Solution:
Observe the graph where the horizontal axis represents Height (in feet) and the vertical axis represents Weight (in pounds). The points are labeled P, Q, R, and S.
(a) What are the two variables represented in the graph?
The two variables represented in the graph are:
- The variable represented on the horizontal axis (x-axis) is Height (in feet).
- The variable represented on the vertical axis (y-axis) is Weight (in pounds).
(b) Which point represents each animal? Explain.
To determine which point represents each animal, we compare the relative heights and weights of the animals shown in the drawing with the coordinates of the points on the graph.
- Point R has the lowest height (approximately 0.75 ft) and the lowest weight (approximately 10 lbs). This corresponds to the smallest animal among the four, which is typically the dog.
- Point S has a height of approximately 1.5 ft and a weight of approximately 50 lbs. This represents an animal that is taller and heavier than the one at point R, but still relatively small compared to the other two. This is likely the crocodile, which is relatively short but heavier than a dog.
- Point P has a height of approximately 2.5 ft and a weight of approximately 250 lbs. This represents an animal that is taller and significantly heavier than the animals represented by R and S. This likely corresponds to the donkey.
- Point Q has the greatest height (approximately 5.5 ft) and the greatest weight (approximately 400 lbs). This represents the tallest and heaviest animal among the given options. This corresponds to the ostrich.
Therefore:
- Point R represents the dog.
- Point S represents the crocodile.
- Point P represents the donkey.
- Point Q represents the ostrich.
Question 84. The two graphs below compare Car A and Car B. The left graph shows the relationship between age and value. The right graph shows the relationship between size and maximum speed.

Use the graphs to determine whether each statement is true or false, and explain your answer.
(a) The older car is less valuable.
(b) The faster car is larger.
(c) The larger car is older.
(d) The faster car is older.
(e) The more valuable car is slower.
Answer:
(a) True
The left graph shows the relationship between age and value for both Car A and Car B. For both cars, the value decreases as the age increases. This indicates that an older car of the same model is less valuable than a younger car of that model.
(b) False
The right graph shows the relationship between size and maximum speed. Comparing Car A and Car B, Car A is generally faster than Car B (its line is above Car B's line). However, the graph shows that both cars cover the same range of sizes (from approximately 1.5 to 5 units). Therefore, the faster car (Car A) is not necessarily larger than the slower car (Car B).
(c) False
The provided graphs show the relationship between age and value, and between size and maximum speed. There is no information in these graphs that relates the size of a car to its age. Thus, we cannot determine from these graphs whether a larger car is older.
(d) False
The provided graphs do not show any relationship between the speed of a car and its age. Therefore, it is not possible to determine from these graphs whether a faster car is older.
(e) False
Comparing Car A and Car B: The left graph shows that Car A is generally more valuable than Car B (Car A's line is above Car B's line). The right graph shows that Car A is generally faster than Car B (Car A's line is above Car B's line). Therefore, the more valuable car (Car A) is also the faster car. The statement "The more valuable car is slower" is incorrect based on the information provided in the graphs.
Question 85. Sonal and Anmol made a sequence of tile designs from square white tiles surrounding one square purple tile. The purple tiles come in many sizes. Three of the designs are shown below.
(a) Copy and complete the table
| Side Length of Purple Tiles | 1 | 2 | 3 | 4 | 5 | 10 | 100 |
|---|---|---|---|---|---|---|---|
| Number of white Tiles in Border |
(b) Draw a graph using the first five pairs of numbers in your table.
(c) Do the points lie on a line?
Answer:
(a) Let $s$ be the side length of the square purple tile. The white tiles form a border around the purple tile. The total arrangement of tiles forms a larger square with side length $(s+2)$. The number of white tiles is the area of the large square minus the area of the purple square.
Number of white tiles = $(s+2)^2 - s^2$
$= (s^2 + 4s + 4) - s^2$
$= 4s + 4$
Using this formula, we can complete the table:
For $s=1$: $4(1) + 4 = 8$
For $s=2$: $4(2) + 4 = 8 + 4 = 12$
For $s=3$: $4(3) + 4 = 12 + 4 = 16$
For $s=4$: $4(4) + 4 = 16 + 4 = 20$
For $s=5$: $4(5) + 4 = 20 + 4 = 24$
For $s=10$: $4(10) + 4 = 40 + 4 = 44$
For $s=100$: $4(100) + 4 = 400 + 4 = 404$
The completed table is:
| Side Length of Purple Tiles | 1 | 2 | 3 | 4 | 5 | 10 | 100 |
|---|---|---|---|---|---|---|---|
| Number of white Tiles in Border | 8 | 12 | 16 | 20 | 24 | 44 | 404 |
(b) To draw a graph using the first five pairs of numbers from the table, we take the Side Length of Purple Tiles ($s$) as the x-coordinate and the Number of white Tiles in Border ($W$) as the y-coordinate. The first five pairs are (1, 8), (2, 12), (3, 16), (4, 20), and (5, 24).
Steps to draw the graph:
1. Draw the x-axis and the y-axis on a graph paper. Label the x-axis as 'Side Length of Purple Tiles ($s$)' and the y-axis as 'Number of white Tiles ($W$)'.
2. Choose an appropriate scale for both axes. For example, you can take 1 unit on the x-axis to represent a side length of 1, and 1 unit on the y-axis to represent 4 white tiles (or any other suitable scale that accommodates the values 8 to 24).
3. Plot the points corresponding to the pairs: (1, 8), (2, 12), (3, 16), (4, 20), and (5, 24).
4. Mark each point clearly on the graph.
(c) To determine if the points lie on a line, we can examine the relationship between $s$ and $W$ or check the slope between consecutive points.
The relationship we found is $W = 4s + 4$. This is a linear equation of the form $y = mx + c$, where $y=W$, $x=s$, $m=4$ (slope), and $c=4$ (y-intercept).
Since the relationship between the side length ($s$) and the number of white tiles ($W$) is linear, the points will lie on a straight line.
Alternatively, we can check the slope between consecutive points:
Slope between (1, 8) and (2, 12) = $\frac{12-8}{2-1} = \frac{4}{1} = 4$
Slope between (2, 12) and (3, 16) = $\frac{16-12}{3-2} = \frac{4}{1} = 4$
Slope between (3, 16) and (4, 20) = $\frac{20-16}{4-3} = \frac{4}{1} = 4$
Slope between (4, 20) and (5, 24) = $\frac{24-20}{5-4} = \frac{4}{1} = 4$
Since the slope is constant between any two consecutive points, the points lie on a straight line.
Yes, the points lie on a line.
Question 86. Sonal and Anmol then made another sequence of the designs. Three of the designs are shown below.
(a) Complete the table.
| Rows, r | 4 | 6 | 8 |
|---|---|---|---|
| Number of white tiles,w | 9 | ||
| Number of Purple tiles,p | 1 |
(b) Draw a graph of rows and number of white tiles. Draw another graph of the number of rows and the number of purple tiles. Put the number of rows on the horizontal axis.
(c) Which graph is linear?
Answer:
(a) The table is completed by observing the pattern in the sequence of designs. Let $r$ be the number of rows, $w$ be the number of white tiles, and $p$ be the number of purple tiles.
From the first design ($r=4$), the table gives $w=9$ and $p=1$.
From the second design ($r=6$), we observe that the purple column has a height of 3 tiles, so $p=3$. Counting the white tiles, there are 3 on the top row, 3 on the bottom row, 5 on the left column of white tiles, and 5 on the right column of white tiles, totalling $3+3+5+5 = 16$ white tiles. So, for $r=6$, $w=16$ and $p=3$.
From the third design ($r=8$), the purple column has a height of 5 tiles, so $p=5$. Counting the white tiles, there are 3 on the top row, 3 on the bottom row, 7 on the left column of white tiles, and 7 on the right column of white tiles, totalling $3+3+7+7 = 20$ white tiles. So, for $r=8$, $w=20$ and $p=5$.
The completed table is:
| Rows, r | 4 | 6 | 8 |
|---|---|---|---|
| Number of white tiles, w | 9 | 16 | 20 |
| Number of Purple tiles, p | 1 | 3 | 5 |
(b) To draw the graphs, we plot the pairs of numbers from the table with the number of rows ($r$) on the horizontal axis (x-axis).
Graph 1 (Rows and number of white tiles): Plot the points (4, 9), (6, 16), and (8, 20).
Graph 2 (Rows and number of purple tiles): Plot the points (4, 1), (6, 3), and (8, 5).
Steps for drawing each graph:
1. Draw the horizontal axis and label it 'Number of Rows (r)'.
2. Draw the vertical axis. For Graph 1, label it 'Number of white tiles (w)'. For Graph 2, label it 'Number of Purple tiles (p)'.
3. Choose appropriate scales for both axes to accommodate the values.
4. Plot the respective points for each graph.
(c) To determine which graph is linear, we can check if the points lie on a straight line by calculating the slopes between consecutive points.
For the graph of rows ($r$) and number of purple tiles ($p$), the points are (4, 1), (6, 3), and (8, 5).
Slope between (4, 1) and (6, 3) = $\frac{3-1}{6-4} = \frac{2}{2} = 1$.
Slope between (6, 3) and (8, 5) = $\frac{5-3}{8-6} = \frac{2}{2} = 1$.
Since the slope is constant (equal to 1), the points for $(r, p)$ lie on a straight line. This graph is linear.
For the graph of rows ($r$) and number of white tiles ($w$), the points are (4, 9), (6, 16), and (8, 20).
Slope between (4, 9) and (6, 16) = $\frac{16-9}{6-4} = \frac{7}{2} = 3.5$.
Slope between (6, 16) and (8, 20) = $\frac{20-16}{8-6} = \frac{4}{2} = 2$.
Since the slopes between consecutive points are not constant (3.5 $\neq$ 2), the points for $(r, w)$ do not lie on a straight line. This graph is not linear.
Therefore, the graph of rows and number of purple tiles is linear.