

Chapter 2 Data Handling (Class 8 - Maths NCERT Exemplar Solutions)
Welcome to the comprehensive resource for NCERT Exemplar Solutions for Class 8 Mathematics: Chapter 2 Data Handling! This chapter is meticulously crafted to enhance students' analytical skills, moving beyond basic representation to the management of larger datasets. These problems focus on organizing raw information into grouped frequency distribution tables, correctly utilizing class intervals and tally marks ($\bcancel{||||}$) to ensure accurate frequency counts.
The solutions provide clear guidance on constructing Histograms for continuous data, emphasizing contiguous bars and precise scaling. Another major focus is the Pie Chart (Circle Graph), where students learn to calculate central angles using the formula: $\text{Central Angle} = \left( \frac{\text{Value of Component}}{\text{Total Value}} \right) \times 360^\circ$. Mastering these visual tools is essential for interpreting complex proportions and deriving meaningful values from graphical data.
Furthermore, the chapter explores Probability through complex experiments like rolling multiple dice or drawing from a standard deck. Students will learn to systematically list the sample space and calculate theoretical probability using the formula: $P(\text{Event}) = \frac{\text{Number of Favorable Outcomes}}{\text{Total Number of Possible Outcomes}}$. With step-by-step instructions and logical justifications prepared by learningspot.co, students can build a solid foundation in data analysis and statistical theory.
| Content On This Page | ||
|---|---|---|
| Solved Examples (Examples 1 to 18) | Question 1 to 35 (Multiple Choice Questions) | Question 36 to 58 (Fill in the Blanks) |
| Question 59 to 81 (True or False) | Question 82 to 116 | |
Solved Examples (Examples 1 to 18)
In examples 1 to 6, there are four options given out of which one is correct. Choose the correct answer.
Example 1: The range of the data– 9, 8, 4, 3, 2, 1, 6, 4, 8, 10, 12, 15, 4, 3 is
(a) 15
(b) 14
(c) 12
(d) 10
Answer:
Given:
Data: 9, 8, 4, 3, 2, 1, 6, 4, 8, 10, 12, 15, 4, 3.
To Find:
The range of the given data.
Solution:
The range of a data set is defined as the difference between the maximum value and the minimum value in the set.
Maximum Value = 15
Minimum Value = 1
Calculation:
$\text{Range} = \text{Maximum} - \text{Minimum}$
$\text{Range} = 15 - 1$
$\text{Range} = 14$
The correct option is (b).
Example 2: The following data : 2, 5, 15, 25, 20, 12, 8, 7, 6, 16, 21, 17, 30, 32, 23, 40, 51, 15, 2, 9, 57, 19, 25 is grouped in the classes 0 –5, 5 –10, 10 –15 etc. Find the frequency of the class 20 – 25.
(a) 5
(b) 4
(c) 3
(d) 2
Answer:
Given:
Data: 2, 5, 15, 25, 20, 12, 8, 7, 6, 16, 21, 17, 30, 32, 23, 40, 51, 15, 2, 9, 57, 19, 25.
To Find:
Frequency of the class interval 20 – 25.
Solution:
In a grouped frequency distribution, the class interval 20 – 25 includes all observations that are greater than or equal to 20 and less than 25.
We scan the data for values $x$ such that $20 \leq x < 25$:
The values are: 20, 21, 23.
Number of observations = 3
(Frequency)
Note: The value 25 is not counted in this interval; it belongs to the next class interval 25 – 30.
The correct option is (c).
Example 3: The pie chart depicts the information of viewers watching different type of channels on TV. Which type of programmes are viewed the most?

(a) News
(b) Sports
(c) Entertainment
(d) Informative.
Answer:
To Find:
The type of programme viewed the most based on the pie chart.
Solution:
Observing the sectors in the pie chart and their respective percentages:
1. Entertainment: $50\%$
2. Sports: $25\%$
3. News: $15\%$
4. Informative: $10\%$
The highest percentage corresponds to the most-viewed type of programme.
$50\% > 25\% > 15\% > 10\%$
Therefore, Entertainment programmes are viewed the most.
The correct option is (c).
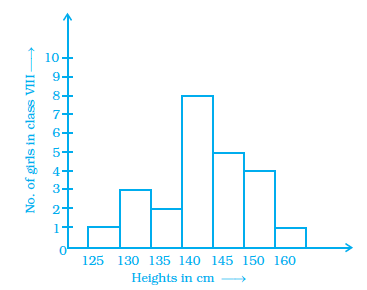
Example 4: Observe the histogram given above. The number of girls having height 145 cm and above is
(a) 5
(b) 10
(c) 17
(d) 19
Answer:
To Find:
Total number of girls with height $\geq 145 \text{ cm}$.
Solution:
From the histogram, we sum the frequencies of all class intervals starting from 145 cm onwards:
1. Height interval 145 – 150: 5 girls
2. Height interval 150 – 160: 4 girls
3. Height interval 160 – 170: 1 girl
Total number of girls = Sum of frequencies in these intervals
$\text{Total} = 5 + 4 + 1$
$\text{Total} = 10$
The number of girls having height 145 cm and above is 10.
The correct option is (b).
Example 5: A dice is thrown two times and sum of the numbers appearing on the dice are noted. The number of possible outcomes is
(a) 6
(b) 11
(c) 18
(d) 36
Answer:
To Find:
The number of possible outcomes for the sum of numbers when a dice is thrown twice.
Solution:
When a dice is thrown twice, the smallest possible sum occurs when both dice show 1:
$\text{Minimum sum} = 1 + 1 = 2$
The largest possible sum occurs when both dice show 6:
$\text{Maximum sum} = 6 + 6 = 12$
The possible sums are all integers between the minimum and maximum values: $\{2, 3, 4, 5, 6, 7, 8, 9, 10, 11, 12\}$.
Let us count the elements in this set:
$\text{Count} = 11$
The number of possible outcomes for the sum is 11.
The correct option is (b).
Example 6: The probability of getting a multiple of 2 when a dice is rolled is
(a) $\frac{1}{6}$
(b) $\frac{1}{3}$
(c) $\frac{1}{2}$
(d) $\frac{2}{3}$
Answer:
To Find:
Probability of getting a multiple of 2 on a single dice roll.
Solution:
Total possible outcomes on a dice = $\{1, 2, 3, 4, 5, 6\}$
$\text{Total number of outcomes} = 6$
Favourable outcomes (multiples of 2) = $\{2, 4, 6\}$
$\text{Number of favourable outcomes} = 3$
Probability is calculated as:
$P(\text{Multiple of 2}) = \frac{\text{Favourable Outcomes}}{\text{Total Outcomes}}$
$P = \frac{3}{6}$
$P = \frac{1}{2}$
The correct option is (c).
In examples 7 to 9 fill in the blanks to make statements true.
Example 7: The fourth class interval for a grouped data whose first and second class intervals are 10 –15 and 15 –20 respectively is __________.
Answer:
Solution:
The class width (size) is the difference between the upper limit and the lower limit.
$\text{Class Width} = 15 - 10 = 5$
The intervals follow a sequence based on this width:
1st class interval = 10 – 15
2nd class interval = 15 – 20
3rd class interval = 20 – 25
4th class interval = 25 – 30
Therefore, the blank should be filled with 25 – 30.
Example 8: In the class interval 250 – 275, 250 is known as the _________.
Answer:
Solution:
In any class interval expressed as $a - b$, the smaller value $a$ is the lower class limit and the larger value $b$ is the upper class limit.
For the interval 250 – 275, 250 is the lower limit (or lower class limit).
Therefore, the blank should be filled with lower limit.
Example 9: The number of times a particular observation occurs in the given data is called its __________.
Answer:
Solution:
By definition in statistics, the count of how many times a specific value or observation appears in a data set is referred to as its frequency.
Therefore, the blank should be filled with frequency.
In examples 10 to 12, state whether the statements are true (T) or false (F).
Example 10: The central angle of the sectors in a pie chart will be a fraction of 360°.
Answer:
Solution:
The total angle at the centre of a circle is $360^\circ$. In a pie chart, each category is represented by a sector whose central angle is calculated as:
$\text{Central Angle} = \frac{\text{Component Value}}{\text{Total Value}} \times 360^\circ$
Since the component value is always a portion of the total value, the angle will always be a fraction of $360^\circ$.
The statement is True (T).
Example 11: On throwing a dice, the probability of occurrence of an odd number is $\frac{1}{2}$ .
Answer:
Solution:
Total outcomes on a dice = $\{1, 2, 3, 4, 5, 6\}$ (Total = 6)
Favourable outcomes (Odd numbers) = $\{1, 3, 5\}$ (Total = 3)
$\text{Probability} = \frac{3}{6} = \frac{1}{2}$
The statement is True (T).
Example 12: A pie chart is also called a pictograph.
Answer:
Solution:
A pie chart uses sectors of a circle to represent data, whereas a pictograph uses pictures or symbols to represent data. They are different methods of data representation.
The statement is False (F).
Example 13: The weekly wages (in Rs.) of 30 workers in a factory are
| 830 | 835 | 890 | 810 | 835 | 836 | 869 | 845 | 898 | 890 |
| 820 | 860 | 832 | 833 | 855 | 845 | 804 | 808 | 812 | 840 |
| 885 | 835 | 835 | 836 | 878 | 840 | 868 | 890 | 806 | 840 |
Using tally marks, make a frequency distribution table with class intervals 800 – 810, 810 – 820 and so on.
Answer:
Given: Weekly wages of 30 workers.
To Find: A frequency distribution table using tally marks with class intervals of size 10.
Solution:
We group the given data into class intervals. Note that in an interval like 800 – 810, the upper limit 810 is excluded and counted in the next interval 810 – 820.
| Class Interval (Wages in $\textsf{₹}$) | Tally Marks | Frequency (No. of workers) |
| 800 – 810 | $|||$ | 3 |
| 810 – 820 | $||$ | 2 |
| 820 – 830 | $|$ | 1 |
| 830 – 840 | $\bcancel{||||}$ $||||$ | 9 |
| 840 – 850 | $\bcancel{||||}$ | 5 |
| 850 – 860 | $|$ | 1 |
| 860 – 870 | $|||$ | 3 |
| 870 – 880 | $|$ | 1 |
| 880 – 890 | $|$ | 1 |
| 890 – 900 | $||||$ | 4 |
| Total | 30 |
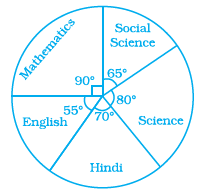
Example 14: The pie chart gives the marks scored in an examination by a student in different subjects. If the total marks obtained were 540, answer the following questions–
(i) In which subject did the student score 105 marks?
(ii) How many more marks were obtained by the student in Mathematics than in Hindi?
Answer:
Given:
Total marks obtained = $540$
Total central angle = $360^\circ$
Solution:
(i) Subject with 105 marks:
To find the subject, we calculate the central angle corresponding to 105 marks.
$\text{Central Angle} = \frac{\text{Marks Scored}}{\text{Total Marks}} \times 360^\circ$
$\text{Angle} = \frac{105}{540} \times 360^\circ$
$\text{Angle} = \frac{105}{3} \times 2 = 35 \times 2 = 70^\circ$
From the pie chart, the subject with a central angle of $70^\circ$ is Hindi.
(ii) Difference between Mathematics and Hindi:
Central angle for Mathematics = $90^\circ$
Central angle for Hindi = $70^\circ$
$\text{Difference in Angles} = 90^\circ - 70^\circ = 20^\circ$
Now, convert this difference into marks:
$\text{Difference in Marks} = \frac{20^\circ}{360^\circ} \times 540$
$\text{Difference} = \frac{1}{18} \times 540 = 30$
The student obtained 30 more marks in Mathematics than in Hindi.
Example 15: Draw a pie chart for the given data.
Favourite food
North Indian
South Indian
Chinese
Others
Number of people
30
40
25
25
Answer:
Given:
The distribution of people's favourite food is provided as follows:
North Indian = $30$
South Indian = $40$
Chinese = $25$
Others = $25$
To Find:
Construct a pie chart representing the given data.
Solution:
To draw a pie chart, we first need to calculate the total number of people and then determine the central angle for each category.
Step 1: Calculate the Total Frequency
$\text{Total number of people} = 30 + 40 + 25 + 25$
$\text{Total} = 120$
Step 2: Calculate Central Angles
The central angle for each sector is calculated using the formula:
$\text{Central Angle} = \left( \frac{\text{Number of people}}{\text{Total number of people}} \right) \times 360^\circ$
| Favourite Food | Number of People | Calculation | Central Angle |
| North Indian | 30 | $\frac{30}{120} \times 360^\circ$ | $90^\circ$ |
| South Indian | 40 | $\frac{40}{120} \times 360^\circ$ | $120^\circ$ |
| Chinese | 25 | $\frac{25}{120} \times 360^\circ$ | $75^\circ$ |
| Others | 25 | $\frac{25}{120} \times 360^\circ$ | $75^\circ$ |
| Total | 120 | 360° |
Step 3: Steps to Draw the Pie Chart
1. Draw a circle with any convenient radius.
2. Draw a horizontal radius as the starting line.
3. Using a protractor, draw a sector of $90^\circ$ for North Indian food.
4. From the new radius, draw an angle of $120^\circ$ for South Indian food.
5. Continue by drawing an angle of $75^\circ$ for Chinese food.
6. The remaining sector will automatically be $75^\circ$, representing Others.
The resulting pie chart visually represents the proportion of people preferring different cuisines, where South Indian food occupies the largest sector.
Example 16: Draw a histogram for the frequency distribution table given in Example 13 and answer the following questions.
(i) Which class interval has the maximum number of workers?
(ii) How many workers earn Rs. 850 and more?
(iii) How many workers earn less than Rs. 850?
(iv) How many workers earn Rs. 820 or more but less than Rs. 880?
Answer:
Given:
The frequency distribution of weekly wages for 30 workers as organized in the previous step:
| Class Interval (Wages in $\textsf{₹}$) | Frequency (No. of workers) |
| 800 – 810 | 3 |
| 810 – 820 | 2 |
| 820 – 830 | 1 |
| 830 – 840 | 9 |
| 840 – 850 | 5 |
| 850 – 860 | 1 |
| 860 – 870 | 3 |
| 870 – 880 | 1 |
| 880 – 890 | 1 |
| 890 – 900 | 4 |
| Total | 30 |
To Find:
(i) Class interval with maximum workers.
(ii) Number of workers earning $\textsf{₹} 850$ and more.
(iii) Number of workers earning less than $\textsf{₹} 850$.
(iv) Number of workers earning $\textsf{₹} 820$ or more but less than $\textsf{₹} 880$.
Solution:
(i) Class interval with the maximum number of workers:
By observing the frequency column, the highest frequency is 9.
$\text{Maximum frequency} = 9$
(Corresponding to 830 – 840)
Therefore, the class interval 830 – 840 has the maximum number of workers.
(ii) Number of workers earning $\textsf{₹} 850$ and more:
We sum the frequencies of all class intervals from 850 – 860 up to 890 – 900.
$\text{Workers} = 1 + 3 + 1 + 1 + 4$
(Frequencies from 850 onwards)
$\text{Total} = 10$
There are 10 workers who earn $\textsf{₹} 850$ and more.
(iii) Number of workers earning less than $\textsf{₹} 850$:
We sum the frequencies of all class intervals from 800 – 810 up to 840 – 850.
$\text{Workers} = 3 + 2 + 1 + 9 + 5$
(Frequencies below 850)
$\text{Total} = 20$
There are 20 workers who earn less than $\textsf{₹} 850$.
(iv) Number of workers earning $\textsf{₹} 820$ or more but less than $\textsf{₹} 880$:
We sum the frequencies for the intervals 820 – 830, 830 – 840, 840 – 850, 850 – 860, 860 – 870, and 870 – 880.
$\text{Workers} = 1 + 9 + 5 + 1 + 3 + 1$
(Intervals between 820 and 880)
$\text{Total} = 20$
There are 20 workers who earn $\textsf{₹} 820$ or more but less than $\textsf{₹} 880$.
Graphical Representation (Histogram):
The following histogram represents the distribution of these wages:
Example 17: Read the frequency distribution table given below and answer the questions that follow:
| Class Interval | Frequency |
|---|---|
| 35 - 35 | 1 |
| 35 - 45 | 5 |
| 45 - 55 | 5 |
| 55 - 65 | 4 |
| 65 - 75 | 0 |
| 75 - 85 | 8 |
| 85 - 95 | 2 |
| Total | 25 |
(i) Class interval which has the lowest frequency.
(ii) Class interval which has the highest frequency.
(iii) What is the class size of the intervals?
(iv) What is the upper limit of the fifth class?
(v) What is the lower limit of the last class?
Answer:
Given:
A frequency distribution table with class intervals and their corresponding frequencies for 25 observations.
Solution:
(i) Class interval which has the lowest frequency:
From the table, the frequencies are 1, 5, 5, 4, 0, 8, and 2. The lowest frequency is 0.
The class interval with frequency 0 is 65 – 75.
(ii) Class interval which has the highest frequency:
The highest frequency in the given data is 8.
The class interval with frequency 8 is 75 – 85.
(iii) What is the class size of the intervals?
Class size is calculated as the difference between the upper limit and the lower limit of a class interval.
$\text{Class size} = \text{Upper limit} - \text{Lower limit}$
$\text{Class size} = 45 - 35 = 10$
The class size is 10.
(iv) What is the upper limit of the fifth class?
Let us list the classes in order:
1st class: 35 – 35
2nd class: 35 – 45
3rd class: 45 – 55
4th class: 55 – 65
5th class: 65 – 75
The upper limit of the fifth class (65 – 75) is 75.
(v) What is the lower limit of the last class?
The last class interval in the table is 85 – 95.
The lower limit of the class 85 – 95 is 85.
Example 18: Application on problem solving strategy
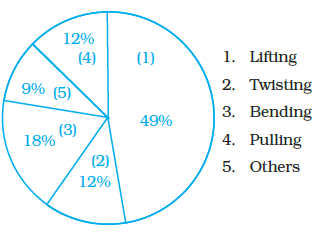
Given below is a pie chart depicting the reason given by people who had injured their lower back. Study the pie chart and find the number of people who injured their back while either bending and lifting. A total of 600 people were surveyed.
Answer:
Given:
Total number of people surveyed = $600$
Percentage of people injured while lifting = $49\%$
Percentage of people injured while bending = $18\%$
To Find:
The total number of people who injured their back while either bending or lifting.
Solution:
First, we find the combined percentage of people who were injured due to bending and lifting.
$\text{Total Percentage} = 49\% + 18\%$
$\text{Total Percentage} = 67\%$
Now, we calculate the number of people representing $67\%$ of the total survey population ($600$):
$\text{Number of people} = 67\% \text{ of } 600$
$\text{Number of people} = \frac{67}{100} \times 600$
$\text{Number of people} = 67 \times 6$
$\text{Number of people} = 402$
Therefore, 402 people injured their back while either bending or lifting.
Exercise
Question 1 to 35 (Multiple Choice Questions)
In questions 1 to 35 there are four options given, out of which one is correct. Choose the correct answer.
Question 1. The height of a rectangle in a histogram shows the
(a) Width of the class
(b) Upper limit of the class
(c) Lower limit of the class
(d) Frequency of the class
Answer:
In a histogram, the data is represented using rectangular bars. The base of each rectangle represents the class interval (width), and the height of the rectangle represents the frequency (number of observations) of that specific class interval.
The correct option is (d).
Question 2. A geometric representation showing the relationship between a whole and its parts is a
(a) Pie chart
(b) Histogram
(c) Bar graph
(d) Pictograph
Answer:
A pie chart (also known as a circle graph) is used to represent data where the entire circle represents the "whole" and each sector represents a "part" of that whole. The size of each sector is proportional to the information it represents.
The correct option is (a).
Question 3. In a pie chart, the total angle at the centre of the circle is
(a) 180°
(b) 360°
(c) 270°
(d) 90°
Answer:
In a pie chart, the data is distributed within a circle. Since the sum of the angles around the centre of a circle is always a complete turn, the total angle at the centre is $360^\circ$.
The correct option is (b).
Question 4. The range of the data 30, 61, 55, 56, 60, 20, 26, 46, 28, 56 is
(a) 26
(b) 30
(c) 41
(d) 61
Answer:
Given:
Data set: 30, 61, 55, 56, 60, 20, 26, 46, 28, 56
To Find:
The range of the data.
Solution:
The range is the difference between the highest and the lowest observations in a data set.
$\text{Highest Observation} = 61$
$\text{Lowest Observation} = 20$
$\text{Range} = 61 - 20$
$\text{Range} = 41$
The correct option is (c).
Question 5. Which of the following is not a random experiment?
(a) Tossing a coin
(b) Rolling a dice
(c) Choosing a card from a deck of 52 cards
(d) Thowing a stone from a roof of a building
Answer:
A random experiment is an experiment where the result cannot be predicted with certainty. Tossing a coin, rolling a dice, and choosing a card are random because multiple outcomes are possible. However, throwing a stone from a roof is not a random experiment because the outcome (the stone falling down due to gravity) is certain and predictable.
The correct option is (d).
Question 6. What is the probability of choosing a vowel from the alphabets?
(a) $\frac{21}{26}$
(b) $\frac{5}{26}$
(c) $\frac{1}{26}$
(d) $\frac{3}{26}$
Answer:
To Find:
Probability of choosing a vowel from the English alphabets.
Solution:
Total number of alphabets in English = 26
Number of vowels (a, e, i, o, u) = 5
The probability is calculated as:
$P(\text{Vowel}) = \frac{\text{Number of Favourable Outcomes}}{\text{Total Number of Outcomes}}$
$P = \frac{5}{26}$
The correct option is (b).
Question 7. In a school only, 3 out of 5 students can participate in a competition. What is the probability of the students who do not make it to the competition?
(a) 0.65
(b) 0.4
(c) 0.45
(d) 0.6
Answer:
Given:
3 out of 5 students participate in a competition.
To Find:
Probability of students who do not make it to the competition.
Solution:
Total students = 5
Students who participate = 3
Students who do not participate = $5 - 3 = 2$
$P(\text{Not participating}) = \frac{2}{5}$
Converting the fraction into decimal form:
$\frac{2}{5} = 0.4$
The correct option is (b).
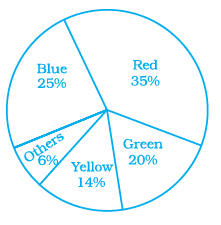
Students of a class voted for their favourite colour and a pie chart was prepared based on the data collected.
Observe the pie chart given below and answer questions 8 –10 based on it.
Question 8. Which colour received $\frac{1}{5}$ of the votes?
(a) Red
(b) Blue
(c) Green
(d) Yellow
Answer:
Given:
A pie chart showing percentages of votes for different colours.
To Find:
Which colour received $1/5$ of the votes.
Solution:
First, convert the fraction $1/5$ into a percentage:
$\text{Percentage} = \frac{1}{5} \times 100\%$
$\text{Percentage} = 20\%$
The colour Green has exactly $20\%$ of the votes.
The correct option is (c).
Question 9. If 400 students voted in all, then how many did vote ‘Others’ colour as their favourite?
(a) 6
(b) 20
(c) 24
(d) 40
Answer:
Given:
Total students = 400
Percentage for 'Others' = $6\%$
To Find:
Number of students who voted for 'Others'.
Solution:
$\text{Number of students} = 6\% \text{ of } 400$
$\text{Number} = \frac{6}{100} \times 400$
$\text{Number} = 6 \times 4 = 24$
The correct option is (c).
Question 10. Which of the following is a reasonable conclusion for the given data?
(a) $\frac{1}{20}$ th student voted for blue colour
(b) Green is the least popular colour
(c) The number of students who voted for red colour is two times the number of students who voted for yellow colour
(d) Number of students liking together yellow and green colour is approximately the same as those for red colour.
Answer:
To Find:
The most reasonable conclusion from the given pie chart.
Solution:
Let us check the options based on the chart percentages:
Red: $35\%$, Blue: $25\%$, Green: $20\%$, Yellow: $14\%$, Others: $6\%$
(a) Blue is $25\%$, which is $1/4$ of the total, not $1/20$. (Incorrect)
(b) 'Others' ($6\%$) is less popular than Green ($20\%$). (Incorrect)
(c) Red is $35\%$ and Yellow is $14\%$. Since $14 \times 2 = 28$, Red is not two times Yellow. (Incorrect)
(d) Combined percentage for Yellow and Green:
$14\% + 20\% = 34\%$
Since the percentage for Red is $35\%$, the sum of Yellow and Green ($34\%$) is approximately the same as Red ($35\%$).
The correct option is (d).
Question 11. Listed below are the temperature in °C for 10 days.
| –6 | –8 | 0 | 3 | 2 | 0 | 1 | 5 | 4 | 4 |
What is the range of the data?
(a) 8
(b) 13°C
(c) 10°C
(d) 12°C
Answer:
Given:
Temperatures ($in$ $^\circ\text{C}$): $-6, -8, 0, 3, 2, 0, 1, 5, 4, 4$
To Find:
The range of the given data.
Solution:
First, we identify the maximum and minimum values from the given data set.
Maximum temperature = $5^\circ\text{C}$
Minimum temperature = $-8^\circ\text{C}$
We know that the Range of a data set is the difference between the maximum and the minimum observation.
$\text{Range} = \text{Maximum value} - \text{Minimum value}$
$\text{Range} = 5 - (-8)$
$\text{Range} = 5 + 8$
$\text{Range} = 13^\circ\text{C}$
Hence, the correct option is (b).
Question 12. Ram put some buttons on the table. There were 4 blue, 7 red, 3 black and 6 white buttons in all. All of a sudden, a cat jumped on the table and knocked out one button on the floor. What is the probability that the button on the floor is blue?
(a) $\frac{7}{20}$
(b) $\frac{3}{5}$
(c) $\frac{1}{5}$
(d) $\frac{1}{4}$
Answer:
Given:
Number of blue buttons = $4$
Number of red buttons = $7$
Number of black buttons = $3$
Number of white buttons = $6$
To Find:
Probability that the button is blue.
Solution:
First, we calculate the total number of buttons (Total outcomes):
$\text{Total buttons} = 4 + 7 + 3 + 6 = 20$
Number of favorable outcomes (blue buttons) = $4$
The formula for probability is:
$P(\text{Event}) = \frac{\text{Number of favorable outcomes}}{\text{Total number of outcomes}}$
$P(\text{blue}) = \frac{\cancel{4}^1}{\cancel{20}_{5}}$
$P(\text{blue}) = \frac{1}{5}$
Hence, the correct option is (c).
Question 13. Rahul, Varun and Yash are playing a game of spinning a coloured wheel. Rahul wins if spinner lands on red. Varun wins if spinner lands on blue and Yash wins if it lands on green. Which of the following spinner should be used to make the game fair?
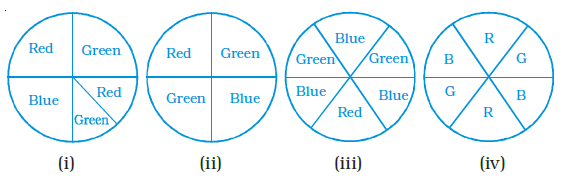
(a) (i)
(b) (ii)
(c) (iii)
(d) (iv)
Answer:
Given:
Condition for winning:
1. Rahul wins if the spinner lands on Red.
2. Varun wins if the spinner lands on Blue.
3. Yash wins if the spinner lands on Green.
To Find:
The spinner that makes the game fair.
Solution:
A game is considered fair if every player has an equal probability of winning. Since there are three players, each player must have a probability of $\frac{1}{3}$ to win for the game to be fair.
Let us analyze the sectors in each spinner provided in the figure:
Analysis of Spinner (i):
The wheel is divided into unequal sectors. The area for Red and Green is larger than the area for Blue. Since the sectors are not equal, the probabilities are not equal. Thus, it is not a fair spinner.
Analysis of Spinner (ii):
The wheel is divided into 4 equal quadrants. By counting the labels:
$P(\text{Red}) = \frac{1}{4}, P(\text{Blue}) = \frac{1}{4}, P(\text{Green}) = \frac{2}{4}$
Since Yash (Green) has a higher chance of winning, the game is not fair.
Analysis of Spinner (iii):
The wheel is divided into 6 equal sectors. By counting the labels:
Number of Red sectors = $1$
Number of Green sectors = $2$
Number of Blue sectors = $3$
The probabilities are $\frac{1}{6}$, $\frac{2}{6}$, and $\frac{3}{6}$ respectively. Since they are different, the game is not fair.
Analysis of Spinner (iv):
The wheel is divided into 6 equal sectors. Looking closely at the figure, the labels are distributed as follows:
Number of Red sectors (R) = $2$
Number of Green sectors (G) = $2$
Number of Blue sectors (B) = $2$
Now, let's calculate the winning probability for each player:
$P(\text{Rahul}) = \frac{2}{6} = \frac{1}{3}$
(Probability of Red)
$P(\text{Varun}) = \frac{2}{6} = \frac{1}{3}$
(Probability of Blue)
$P(\text{Yash}) = \frac{2}{6} = \frac{1}{3}$
(Probability of Green)
Since the probability of winning is exactly the same for Rahul, Varun, and Yash, spinner (iv) makes the game fair.
Hence, the correct option is (d).
Question 14. In a frequency distribution with classes 0 –10, 10 –20 etc., the size of the class intervals is 10. The lower limit of fourth class is
(a) 40
(b) 50
(c) 20
(d) 30
Answer:
Given:
Class intervals: $0 - 10, 10 - 20, \dots$
Class size = $10$
To Find:
The lower limit of the fourth class.
Solution:
Let's list the class intervals sequentially:
1st Class interval: $0 - 10$
2nd Class interval: $10 - 20$
3rd Class interval: $20 - 30$
4th Class interval: $30 - 40$
In a class interval $a - b$, '$a$' is called the lower limit and '$b$' is called the upper limit.
For the fourth class ($30 - 40$), the lower limit is $30$.
Hence, the correct option is (d).
Question 15. A coin is tossed 200 times and head appeared 120 times. The probability of getting a head in this experiment is
(a) $\frac{2}{5}$
(b) $\frac{3}{5}$
(c) $\frac{1}{5}$
(d) $\frac{4}{5}$
Answer:
Given:
Total number of trials = $200$
Number of times head appeared = $120$
To Find:
Probability of getting a head.
Solution:
The probability is calculated as:
$P(\text{Head}) = \frac{\text{Number of heads}}{\text{Total number of tosses}}$
$P(\text{Head}) = \frac{120}{200}$
Simplifying the fraction:
$P(\text{Head}) = \frac{\cancel{120}^{3}}{\cancel{200}_{5}}$
$P(\text{Head}) = \frac{3}{5}$
(Dividing both by 40)
Hence, the correct option is (b).
Question 16. Data collected in a survey shows that 40% of the buyers are interested in buying a particular brand of toothpaste. The central angle of the sector of the pie chart representing this information is
(a) 120°
(b) 150°
(c) 144°
(d) 40°
Answer:
Given:
Percentage of buyers interested = $40\%$
To Find:
Central angle of the sector.
Solution:
We know that the total angle at the center of a pie chart (circle) is $360^\circ$, which represents $100\%$.
The formula for the central angle is:
$\text{Central Angle} = \frac{\text{Percentage value}}{100} \times 360^\circ$
$\text{Central Angle} = \frac{40}{100} \times 360^\circ$
$\text{Central Angle} = \frac{4}{10} \times 360^\circ$
$\text{Central Angle} = 4 \times 36^\circ$
$\text{Central Angle} = 144^\circ$
Hence, the correct option is (c).
Question 17. Monthly salary of a person is Rs. 15000. The central angle of the sector representing his expenses on food and house rent on a pie chart is 60°. The amount he spends on food and house rent is
(a) Rs. 5000
(b) Rs. 2500
(c) Rs. 6000
(d) Rs. 9000
Answer:
Given:
Total monthly salary = $\textsf{₹} 15,000$
Central angle of the sector = $60^\circ$
To Find:
Amount spent on food and house rent.
Solution:
The amount for a specific sector can be calculated using the following formula:
$\text{Amount} = \frac{\text{Central Angle}}{360^\circ} \times \text{Total Amount}$
$\text{Amount} = \frac{60^\circ}{360^\circ} \times 15000$
$\text{Amount} = \frac{1}{6} \times 15000$
$\text{Amount} = \textsf{₹} 2,500$
Hence, the correct option is (b).
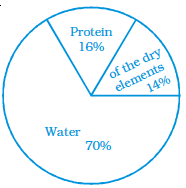
Question 18. The following pie chart gives the distribution of constituents in the human body. The central angle of the sector showing the distribution of protein and other constituents is
(a) 108°
(b) 54°
(c) 30°
(d) 216°
Answer:
Given:
From the pie chart:
Distribution of Water = $70\%$
Distribution of Protein = $16\%$
Distribution of other dry elements = $14\%$
To Find:
The central angle for "protein and other constituents" combined.
Solution:
First, we find the total percentage of protein and other constituents:
$\text{Total percentage} = 16\% + 14\% = 30\%$
Now, we calculate the central angle for this combined $30\%$:
$\text{Central Angle} = \frac{\text{Percentage}}{100} \times 360^\circ$
$\text{Central Angle} = \frac{30}{100} \times 360^\circ$
$\text{Central Angle} = 3 \times 36^\circ$
$\text{Central Angle} = 108^\circ$
Hence, the correct option is (a).
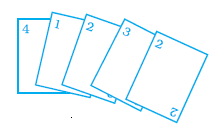
Question 19. Rohan and Shalu are playing with 5 cards as shown in the figure. What is the probability of Rohan picking a card without seeing, that has the number 2 on it?
(a) $\frac{2}{5}$
(b) $\frac{1}{5}$
(c) $\frac{3}{5}$
(d) $\frac{4}{5}$
Answer:
Given:
The numbers on the 5 cards are: $4, 1, 2, 3, 2$
To Find:
The probability of picking a card with the number $2$.
Solution:
Total number of outcomes (total cards) = $5$
Number of favorable outcomes (cards with number 2) = $2$
The formula for probability is:
$P(\text{picking number 2}) = \frac{\text{Number of favorable outcomes}}{\text{Total number of outcomes}}$
$P(\text{picking number 2}) = \frac{2}{5}$
Hence, the correct option is (a).
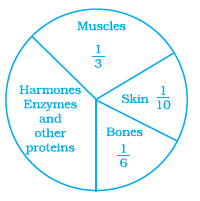
Question 20. The following pie chart represents the distribution of proteins in parts of a human body. What is the ratio of distribution of proteins in the muscles to that of proteins in the bones?
(a) 3 : 1
(b) 1 : 2
(c) 1 : 3
(d) 2 : 1
Answer:
Given:
From the pie chart:
Distribution in Muscles = $\frac{1}{3}$
Distribution in Bones = $\frac{1}{6}$
To Find:
The ratio of proteins in muscles to proteins in bones.
Solution:
$\text{Required Ratio} = \text{Muscles} : \text{Bones}$
$\text{Ratio} = \frac{1}{3} : \frac{1}{6}$
To simplify the ratio, we can write it as a fraction:
$\text{Ratio} = \frac{\frac{1}{3}}{\frac{1}{6}}$
$\text{Ratio} = \frac{1}{3} \times \frac{6}{1}$
$\text{Ratio} = \frac{6}{3}$
$\text{Ratio} = \frac{2}{1} = 2 : 1$
Hence, the correct option is (d).
Question 21. What is the central angle of the sector (in the above pie chart) representing skin and bones together?
(a) 36°
(b) 60°
(c) 90°
(d) 96°
Answer:
Given:
Distribution in Skin = $\frac{1}{10}$
Distribution in Bones = $\frac{1}{6}$
To Find:
The central angle representing skin and bones together.
Solution:
First, we find the combined fraction of skin and bones:
$\text{Combined fraction} = \frac{1}{10} + \frac{1}{6}$
Taking the LCM of $10$ and $6$, which is $30$:
$\text{Combined fraction} = \frac{1 \times 3 + 1 \times 5}{30}$
$\text{Combined fraction} = \frac{3 + 5}{30} = \frac{8}{30} = \frac{4}{15}$
Now, we calculate the central angle:
$\text{Central Angle} = \text{Fraction} \times 360^\circ$
$\text{Central Angle} = \frac{4}{15} \times 360^\circ$
$\text{Central Angle} = 4 \times 24^\circ$
$\text{Central Angle} = 96^\circ$
Hence, the correct option is (d).
Question 22. What is the central angle of the sector (in the above pie chart) representing hormones enzymes and other proteins.
(a) 120°
(b) 144°
(c) 156°
(d) 176°
Answer:
Given:
Muscles fraction = $\frac{1}{3}$
Skin fraction = $\frac{1}{10}$
Bones fraction = $\frac{1}{6}$
To Find:
Central angle for hormones, enzymes, and other proteins.
Solution:
First, we find the fraction for the "Hormones, Enzymes and other proteins" sector by subtracting the sum of other sectors from $1$.
$\text{Sum of given sectors} = \frac{1}{3} + \frac{1}{10} + \frac{1}{6}$
Taking the LCM of $3, 10, \text{ and } 6$, which is $30$:
$\text{Sum} = \frac{10 + 3 + 5}{30} = \frac{18}{30} = \frac{3}{5}$
$\text{Fraction for Hormones/Enzymes} = 1 - \frac{3}{5} = \frac{2}{5}$
Now, calculate the central angle:
$\text{Central Angle} = \frac{2}{5} \times 360^\circ$
$\text{Central Angle} = 2 \times 72^\circ$
$\text{Central Angle} = 144^\circ$
Hence, the correct option is (b).
Question 23. A coin is tossed 12 times and the outcomes are observed as shown below:
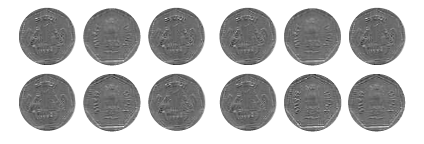
The chance of occurrence of Head is
(a) $\frac{1}{2}$
(b) $\frac{5}{12}$
(c) $\frac{7}{12}$
(d) $\frac{5}{7}$
Answer:
Given:
Total number of tosses = $12$
Observing the image, the outcomes are:
Top Row: Tails, Heads, Tails, Tails, Heads, Tails
Bottom Row: Tails, Heads, Tails, Tails, Heads, Heads
To Find:
The chance (probability) of occurrence of Head.
Solution:
By counting the "Heads" in the given image:
Number of Heads ($H$) = $5$
Total number of outcomes = $12$
The probability is given by:
$P(\text{Head}) = \frac{\text{Number of Heads}}{\text{Total number of outcomes}}$
$P(\text{Head}) = \frac{5}{12}$
Hence, the correct option is (b).
Question 24. Total number of outcomes, when a ball is drawn from a bag which contains 3 red, 5 black and 4 blue balls is
(a) 8
(b) 7
(c) 9
(d) 12
Answer:
Given:
Number of red balls = $3$
Number of black balls = $5$
Number of blue balls = $4$
To Find:
Total number of outcomes.
Solution:
The total number of outcomes is simply the sum of all the possible items that can be drawn from the bag.
$\text{Total outcomes} = \text{Red balls} + \text{Black balls} + \text{Blue balls}$
$\text{Total outcomes} = 3 + 5 + 4$
$\text{Total outcomes} = 12$
Hence, the correct option is (d).
Question 25. A graph showing two sets of data simultaneously is known as
(a) Pictograph
(b) Histogram
(c) Pie chart
(d) Double bar graph
Answer:
Solution:
A Double Bar Graph is used to display two sets of data on the same graph, allowing for easy comparison between them (e.g., comparing marks of two students in different subjects or comparing sales of two years).
Hence, the correct option is (d).
Question 26. Size of the class 150 – 175 is
(a) 150
(b) 175
(c) 25
(d) –25
Answer:
Given:
Class interval = $150 - 175$
To Find:
Class size.
Solution:
The Class Size is defined as the difference between the upper class limit and the lower class limit.
$\text{Class Size} = \text{Upper Limit} - \text{Lower Limit}$
$\text{Class Size} = 175 - 150$
$\text{Class Size} = 25$
Hence, the correct option is (c).
Question 27. In a throw of a dice, the probability of getting the number 7 is
(a) $\frac{1}{2}$
(b) $\frac{1}{6}$
(c) 1
(d) 0
Answer:
Given:
A standard dice is thrown.
To Find:
Probability of getting the number $7$.
Solution:
A standard six-sided dice has the following possible outcomes:
$\text{Sample Space} = \{1, 2, 3, 4, 5, 6\}$
Total number of outcomes = $6$
Since the number $7$ is not present on a standard dice, it is an impossible event.
Number of favorable outcomes = $0$
$P(\text{Getting 7}) = \frac{0}{6} = 0$
Hence, the correct option is (d).
Question 28. Data represented using circles is known as
(a) Bar graph
(b) Histogram
(c) Pictograph
(d) Pie chart
Answer:
Solution:
A Pie Chart (also known as a circle graph) represents data by dividing a circle into various sectors, where each sector's area is proportional to the quantity it represents.
Hence, the correct option is (d).
Question 29. Tally marks are used to find
(a) Class intervals
(b) Range
(c) Frequency
(d) Upper limit
Answer:
Solution:
Tally marks are a quick way of keeping track of numbers in groups of five. In statistics, they are used to count the number of times a particular value occurs in a data set, which is known as the frequency.
For example, to represent a frequency of 5, we use tally marks as: $\bcancel{||||}$
Hence, the correct option is (c).
Question 30. Upper limit of class interval 75 –85 is
(a) 10
(b) –10
(c) 75
(d) 85
Answer:
Given:
Class interval = $75 - 85$
To Find:
The upper limit of the given class interval.
Solution:
In any class interval expressed as $a - b$, the first value '$a$' is the lower limit and the second value '$b$' is the upper limit.
For the class interval $75 - 85$:
Lower limit = $75$
Upper limit = $85$
Hence, the correct option is (d).
Question 31. Numbers 1 to 5 are written on separate slips, i.e one number on one slip and put in a box. Wahida pick a slip from the box without looking at it. What is the probability that the slip bears an odd number?
(a) $\frac{1}{5}$
(b) $\frac{2}{5}$
(c) $\frac{3}{5}$
(d) $\frac{4}{5}$
Answer:
Given:
Numbers on the slips: $1, 2, 3, 4, 5$
To Find:
Probability that the slip bears an odd number.
Solution:
First, we identify the total outcomes and favorable outcomes.
Total number of outcomes = $5$ $[$as there are slips numbered $1, 2, 3, 4, 5]$
The odd numbers in the set are $1, 3, \text{ and } 5$.
Number of favorable outcomes (odd numbers) = $3$
The formula for probability is:
$P(\text{Odd number}) = \frac{\text{Number of favorable outcomes}}{\text{Total number of outcomes}}$
$P(\text{Odd number}) = \frac{3}{5}$
Hence, the correct option is (c).
Question 32. A glass jar contains 6 red, 5 green, 4 blue and 5 yellow marbles of same size. Hari takes out a marble from the jar at random. What is the probability that the chosen marble is of red colour?
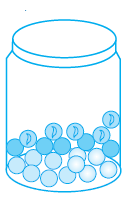
(a) $\frac{7}{10}$
(b) $\frac{3}{10}$
(c) $\frac{4}{5}$
(d) $\frac{2}{5}$
Answer:
Given:
Number of red marbles = $6$
Number of green marbles = $5$
Number of blue marbles = $4$
Number of yellow marbles = $5$
To Find:
Probability that the chosen marble is red.
Solution:
First, we calculate the total number of marbles in the jar:
$\text{Total marbles} = 6 + 5 + 4 + 5 = 20$
Number of favorable outcomes (red marbles) = $6$
The probability of picking a red marble is:
$P(\text{Red}) = \frac{\text{Number of red marbles}}{\text{Total number of marbles}}$
$P(\text{Red}) = \frac{\cancel{6}^3}{\cancel{20}_{10}}$
$P(\text{Red}) = \frac{3}{10}$
(Dividing numerator and denominator by 2)
Hence, the correct option is (b).
Question 33. A coin is tossed two times. The number of possible outcomes is
(a) 1
(b) 2
(c) 3
(d) 4
Answer:
Given:
A coin is tossed $2$ times.
To Find:
The number of possible outcomes.
Solution:
When a coin is tossed, there are $2$ possible outcomes: Head ($H$) or Tail ($T$).
When it is tossed two times, the sample space is:
$S = \{(H, H), (H, T), (T, H), (T, T)\}$
The number of outcomes is $2 \times 2 = 4$.
Hence, the correct option is (d).
Question 34. A coin is tossed three times. The number of possible outcomes is
(a) 3
(b) 4
(c) 6
(d) 8
Answer:
Given:
A coin is tossed $3$ times.
To Find:
The number of possible outcomes.
Solution:
The number of outcomes for tossing a coin '$n$' times is given by the formula $2^n$.
Here, $n = 3$.
$\text{Number of outcomes} = 2^3$
$\text{Number of outcomes} = 2 \times 2 \times 2 = 8$
The outcomes are: $HHH, HHT, HTH, HTT, THH, THT, TTH, TTT$.
Hence, the correct option is (d).
Question 35. A diece is tossed two times. The number of possible outcomes is
(a) 12
(b) 24
(c) 36
(d) 30
Answer:
Given:
A dice is tossed $2$ times.
To Find:
The number of possible outcomes.
Solution:
A single dice has $6$ possible outcomes $\{1, 2, 3, 4, 5, 6\}$.
When a dice is tossed '$n$' times, the number of outcomes is given by $6^n$.
Here, $n = 2$.
$\text{Total outcomes} = 6^2 = 6 \times 6 = 36$
Hence, the correct option is (c).
Question 36 to 58 (Fill in the Blanks)
In questions 36 to 58, fill in the blanks to make the statements true.
Question 36. Data available in an unorganised form is called __________ data.
Answer:
Solution:
Data that is collected in its original form without any processing or classification is known as raw data.
Answer: raw
Question 37. In the class interval 20 – 30, the lower class limit is __________.
Answer:
Solution:
In the class interval $20 - 30$:
The value on the left ($20$) is the lower class limit.
The value on the right ($30$) is the upper class limit.
Answer: 20
Question 38. In the class interval 26 – 33, 33 is known as __________.
Answer:
Solution:
In the class interval $26 - 33$, the higher value represents the boundary at the top of the class.
Answer: upper class limit
Question 39. The range of the data 6, 8, 16, 22, 8, 20, 7, 25 is __________.
Answer:
Given:
Data set: $6, 8, 16, 22, 8, 20, 7, 25$
To Find:
The range of the data.
Solution:
First, we identify the maximum and minimum values from the given data set.
Maximum value = $25$
Minimum value = $6$
The Range is calculated as the difference between the maximum and minimum observations.
$\text{Range} = \text{Maximum value} - \text{Minimum value}$
$\text{Range} = 25 - 6$
$\text{Range} = 19$
Answer: 19
Question 40. A pie chart is used to compare __________ to a whole.
Answer:
Solution:
A pie chart (or circle graph) represents data by dividing a circle into sectors. Each sector represents a part or component of the data, showing its relationship to the whole total.
Answer: parts (or sectors)
Question 41. In the experiment of tossing a coin one time, the outcome is either __________ or __________.
Answer:
Solution:
When a coin is tossed, it has two faces. One face is termed as Head and the other is Tail. These are the only two possible outcomes in a single toss.
Answer: Head or Tail
Question 42. When a dice is rolled, the six possible outcomes are __________.
Answer:
Solution:
A standard dice is a cube with faces numbered from $1$ to $6$. When it is rolled, the possible outcomes that can appear on the top face are the numbers $1, 2, 3, 4, 5, \text{ and } 6$.
Answer: 1, 2, 3, 4, 5, 6
Question 43. Each outcome or a collection of outcomes in an experiment makes an __________.
Answer:
Solution:
In probability, an event is defined as a specific outcome or a set of outcomes of a random experiment. For example, getting an even number on a dice roll is an event consisting of outcomes $\{2, 4, 6\}$.
Answer: event
Question 44. An experiment whose outcomes cannot be predicted exactly in advance is called a __________ experiment.
Answer:
Solution:
An experiment where we know all possible results but cannot determine the specific result before the experiment occurs is known as a random experiment.
Answer: random
Question 45. The difference between the upper and lower limit of a class interval is called the __________ of the class interval.
Answer:
Solution:
In statistics, for a class interval $a - b$, the calculation $b - a$ determines the width or size of the class.
Answer: class size (or width)
Question 46. The sixth class interval for a grouped data whose first two class intervals are 10 – 15 and 15 – 20 is __________.
Answer:
Given:
1st class interval = $10 - 15$
2nd class interval = $15 - 20$
To Find:
The 6th class interval.
Solution:
First, we find the class size:
$\text{Class size} = 15 - 10 = 5$
Now, let's list the intervals sequentially:
1st interval: $10 - 15$
2nd interval: $15 - 20$
3rd interval: $20 - 25$
4th interval: $25 - 30$
5th interval: $30 - 35$
6th interval: $35 - 40$
Answer: 35 – 40
Histogram given on the right shows the number of people owning the different number of books. Answer 47 to 50 based on it.
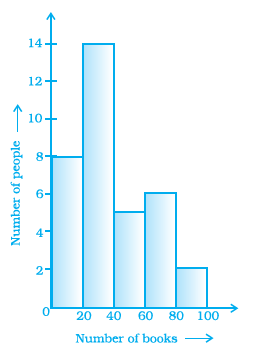
Question 47. The total number of people surveyed is __________.
Answer:
Given:
From the provided histogram, the frequencies (number of people) for different class intervals are:
$0 - 20$ books: $8$ people
$20 - 40$ books: $14$ people
$40 - 60$ books: $5$ people
$60 - 80$ books: $6$ people
$80 - 100$ books: $2$ people
To Find:
Total number of people surveyed.
Solution:
$\text{Total number of people} = 8 + 14 + 5 + 6 + 2$
$\text{Total number of people} = 35$
Answer: 35
Question 48. The number of people owning books more than 60 is __________.
Answer:
Given:
From the histogram, the groups representing more than $60$ books are $60 - 80$ and $80 - 100$.
Solution:
Number of people in the $60 - 80$ range = $6$
Number of people in the $80 - 100$ range = $2$
$\text{Total people (more than 60)} = 6 + 2 = 8$
Answer: 8
Question 49. The number of people owning books less than 40 is __________.
Answer:
Given:
The groups representing less than $40$ books are $0 - 20$ and $20 - 40$.
Solution:
Number of people in the $0 - 20$ range = $8$
Number of people in the $20 - 40$ range = $14$
$\text{Total people (less than 40)} = 8 + 14 = 22$
Answer: 22
Question 50. The number of people having books more than 20 and less than 40 is __________.
Answer:
Given:
The range "more than 20 and less than 40" corresponds directly to the class interval $20 - 40$.
Solution:
By observing the height of the bar for the class interval $20 - 40$ on the y-axis (Number of people):
The frequency is $14$.
Answer: 14
Question 51. The number of times a particular observation occurs in a given data is called its __________.
Answer:
Solution:
In statistics, the count of how many times a specific value or observation appears in a data set is known as its frequency.
For example, if the number $5$ appears $3$ times in a list, its frequency is $3$.
Answer: frequency
Question 52. When the number of observations is large, the observations are usually organised in groups of equal width called __________.
Answer:
Solution:
When dealing with a vast amount of data, it is practical to condense it into groups to make it readable. These groups are known as class intervals.
Answer: class intervals
Question 53. The total number of outcomes when a coin is tossed is __________.
Answer:
Solution:
When a single coin is tossed, there are only two possible results: it can land showing either a Head or a Tail.
$\text{Total number of outcomes} = 2$
Answer: 2
Question 54. The class size of the interval 80 – 85 is __________.
Answer:
Given:
Class interval = $80 - 85$
To Find:
The class size.
Solution:
The class size (or width) is the difference between the upper class limit and the lower class limit.
$\text{Class size} = \text{Upper limit} - \text{Lower limit}$
$\text{Class size} = 85 - 80$
$\text{Class size} = 5$
Answer: 5
Question 55. In a histogram __________ are drawn with width equal to a class interval without leaving any gap in between.
Answer:
Solution:
In a histogram, rectangles (or bars) are constructed such that their bases represent the class intervals and their heights represent the frequencies. Unlike a bar graph, there are no gaps between these rectangles because the data is continuous.
Answer: rectangles
Question 56. When a dice is thrown, outcomes 1, 2, 3, 4, 5, 6 are equally __________.
Answer:
Solution:
In a fair dice, every face has an identical chance of landing face up. Therefore, each outcome ($1, 2, 3, 4, 5, \text{ or } 6$) has a probability of $\frac{1}{6}$. Such outcomes are termed equally likely.
Answer: likely
Question 57. In a histogram, class intervals and frequencies are taken along __________ axis and __________ axis.
Answer:
Solution:
While drawing a histogram on a graph paper:
1. The horizontal axis ($x\text{-axis}$) is used to represent the class intervals.
2. The vertical axis ($y\text{-axis}$) is used to represent the frequencies.
Answer: horizontal (or x) and vertical (or y)
Question 58. In the class intervals 10 –20, 20 –30, etc., respectively, 20 lies in the class __________.
Answer:
Solution:
By convention in a continuous frequency distribution, an observation that is exactly equal to a limit is included in the class where it is the lower limit.
In the interval $10 - 20$, the value $20$ is the upper limit and is excluded.
In the interval $20 - 30$, the value $20$ is the lower limit and is included.
Answer: 20 – 30
Question 59 to 81 (True or False)
In questions 59 to 81, state whether the statements are true (T) or false (F).
Question 59. In a pie chart a whole circle is divided into sectors.
Answer:
Solution:
A pie chart (also known as a circle graph) represents data by dividing the entire area of a circle into various sectors. Each sector is proportional to the fraction of the total it represents.
Answer: True
Question 60. The central angle of a sector in a pie chart cannot be more than 180°.
Answer:
Solution:
The total angle at the center of a circle is $360^\circ$. A single sector can represent any portion of the data. For example, if a category represents $75\%$ of the total data, its central angle would be:
$\text{Angle} = \frac{75}{100} \times 360^\circ = 270^\circ$
Since $270^\circ > 180^\circ$, the statement is incorrect.
Answer: False
Question 61. Sum of all the central angles in a pie chart is 360°.
Answer:
Solution:
A pie chart represents data within a circle. Since the total angle around the center of any circle is $360^\circ$, the sum of all individual sectors' central angles must equal the total angle of the circle.
Answer: True (T)
Question 62. In a pie chart two central angles can be of 180°.
Answer:
Solution:
In a pie chart, if there are exactly two categories of data and each represents $50\%$ of the total, then each sector will have a central angle calculated as:
$\text{Central Angle} = \frac{1}{2} \times 360^\circ = 180^\circ$
In this case, the sum $180^\circ + 180^\circ = 360^\circ$, which is valid for a circle.
Answer: True (T)
Question 63. In a pie chart two or more central angles can be equal.
Answer:
Solution:
If two or more observations or categories in a data set have the same frequency or numerical value, their corresponding sectors in a pie chart will have equal central angles. For example, if two items both represent $20\%$ of the data, both will have a central angle of $72^\circ$.
Answer: True (T)
Question 64. Getting a prime number on throwing a die is an event.
Answer:
Solution:
In probability, an event is a collection of outcomes of an experiment. When a die is thrown, the possible outcomes are $\{1, 2, 3, 4, 5, 6\}$. The prime numbers in this set are $\{2, 3, 5\}$. Since this is a collection of specific outcomes, it constitutes an event.
Answer: True (T)
Using the following frequency table, answer question 65-68
| Marks (obtained out of 10) | 4 | 5 | 7 | 8 | 9 | 10 |
|---|---|---|---|---|---|---|
| Frequency | 5 | 10 | 8 | 6 | 12 | 9 |
Question 65. 9 students got full marks.
Answer:
Given:
Full marks = $10$
Solution:
From the provided frequency table, we look at the column where marks obtained is $10$. The frequency corresponding to $10$ marks is $9$. This means exactly $9$ students obtained full marks.
Answer: True (T)
Question 66. The frequency of less than 8 marks is 29.
Answer:
Given:
Marks less than 8 are: $4, 5, \text{ and } 7$.
Solution:
We need to add the frequencies of marks $4, 5, \text{ and } 7$:
Frequency of 4 marks = $5$
Frequency of 5 marks = $10$
Frequency of 7 marks = $8$
$\text{Total frequency} = 5 + 10 + 8$
$\text{Total frequency} = 23$
Since $23 \neq 29$, the statement is false.
Answer: False (F)
Question 67. The frequency of more than 8 marks is 21.
Answer:
Given:
Marks more than 8 are: $9 \text{ and } 10$.
Solution:
We add the frequencies of marks $9 \text{ and } 10$:
Frequency of 9 marks = $12$
Frequency of 10 marks = $9$
$\text{Total frequency} = 12 + 9$
$\text{Total frequency} = 21$
The calculation matches the statement.
Answer: True (T)
Question 68. 10 marks the highest frequency.
Answer:
Solution:
Let's compare the frequencies from the table:
Frequencies are: $5, 10, 8, 6, 12, 9$
The highest frequency in this data set is $12$.
The mark corresponding to the highest frequency ($12$) is $9$ marks, not $10$ marks.
Answer: False (F)
Question 69. If the fifth class interval is 60 – 65, fourth class interval is 55 – 60, then the first class interval is 45 –50.
Answer:
Given:
5th Class: $60 - 65$
4th Class: $55 - 60$
Solution:
The class size is $65 - 60 = 5$. We can find previous classes by subtracting $5$ from the limits:
5th Class: $60 - 65$
4th Class: $55 - 60$
3rd Class: $50 - 55$
2nd Class: $45 - 50$
1st Class: $40 - 45$
The statement says the first class is $45 - 50$, but according to the sequence, the first class is $40 - 45$.
Answer: False (F)
Question 70. From the histogram given on the right, we can say that 1500 males above the age of 20 are literate.
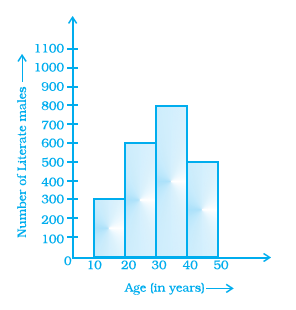
Answer:
Given:
From the histogram, "above the age of 20" includes the class intervals $20-30$, $30-40$, and $40-50$.
Solution:
Observing the heights of the bars (frequencies):
Literate males in age $20-30$ = $600$
Literate males in age $30-40$ = $800$
Literate males in age $40-50$ = $500$
The total is $1900$. The statement claims it is $1500$.
Answer: False (F)
Question 71. The class size of the class interval 60 – 68 is 8.
Answer:
Given:
Class interval = $60 - 68$
Solution:
$\text{Class size} = \text{Upper limit} - \text{Lower limit}$
$\text{Class size} = 68 - 60$
$\text{Class size} = 8$
The calculation matches the statement.
Answer: True (T)
Question 72. If a pair of coins is tossed, then the number of outcomes are 2.
Answer:
Solution:
When a single coin is tossed, the outcomes are Head ($H$) and Tail ($T$), which is $2^1 = 2$.
When a pair of coins is tossed simultaneously, the possible outcomes (Sample Space) are:
$S = \{(H, H), (H, T), (T, H), (T, T)\}$
The total number of outcomes is $2^2 = 4$. The statement says the number of outcomes is $2$.
Answer: False (F)
Question 73. On throwing a dice once, the probability of occurence of an even number is $\frac{1}{2}$ .
Answer:
Given:
A standard dice is thrown once.
To Find:
Probability of getting an even number.
Solution:
The total possible outcomes on a dice are $\{1, 2, 3, 4, 5, 6\}$.
Total outcomes = $6$
Even numbers in the set are $\{2, 4, 6\}$.
Favorable outcomes = $3$
$\text{Probability} = \frac{\text{Number of favorable outcomes}}{\text{Total number of outcomes}}$
$\text{Probability} = \frac{\cancel{3}^1}{\cancel{6}_{2}} = \frac{1}{2}$
The statement is correct.
Answer: True (T)
Question 74. On throwing a dice once, the probability of occurence of a composite number is $\frac{1}{2}$ .
Answer:
Given:
A standard dice is thrown once.
To Find:
Probability of getting a composite number.
Solution:
The outcomes are $\{1, 2, 3, 4, 5, 6\}$.
A composite number is a positive integer greater than $1$ that has at least one divisor other than $1$ and itself.
In the set $\{1, 2, 3, 4, 5, 6\}$:
1 is neither prime nor composite.
2, 3, 5 are prime numbers.
4 and 6 are composite numbers.
Number of favorable outcomes = $2$
(i.e., 4 and 6)
$\text{Probability} = \frac{2}{6} = \frac{1}{3}$
Since $\frac{1}{3} \neq \frac{1}{2}$, the statement is incorrect.
Answer: False (F)
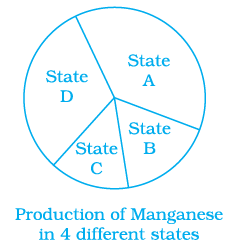
Question 75. From the given pie chart, we can infer that production of Manganese is least in state B.
Answer:
Solution:
In a pie chart, the quantity of data is directly proportional to the area or central angle of the sector. The smallest sector represents the least production.
By observing the provided image:
State D and State A have the largest sectors.
State B is smaller than A and D.
State C has the visibly smallest central angle compared to all other states.
Therefore, the production is least in State C, not State B.
Answer: False (F)
Question 76. One or more outcomes of an experiment make an event.
Answer:
Solution:
In probability theory, an event is defined as a subset of the sample space. This subset can contain a single outcome (elementary event) or multiple outcomes (compound event).
Answer: True (T)
Question 77. The probability of getting number 6 in a throw of a dice is $\frac{1}{6}$ . Similarly the probability of getting a number 5 is $\frac{1}{5}$ .
Answer:
Solution:
On a fair dice, all six numbers $\{1, 2, 3, 4, 5, 6\}$ are equally likely to occur.
$P(\text{Getting 6}) = \frac{1}{6}$
(Correct)
$P(\text{Getting 5}) = \frac{1}{6}$
(Incorrect in the statement)
The probability of getting any single number on a dice is always $\frac{1}{6}$, not $\frac{1}{n}$ where $n$ is the number itself.
Answer: False (F)
Question 78. The probability of getting a prime number is the same as that of a composite number in a throw of a dice.
Answer:
Given:
Dice outcomes: $\{1, 2, 3, 4, 5, 6\}$
Solution:
Prime numbers on a dice: $\{2, 3, 5\}$
$P(\text{Prime}) = \frac{3}{6} = \frac{1}{2}$
Composite numbers on a dice: $\{4, 6\}$
$P(\text{Composite}) = \frac{2}{6} = \frac{1}{3}$
Since $\frac{1}{2} \neq \frac{1}{3}$, the probabilities are not the same.
Answer: False (F)
Question 79. In a throw of a dice, the probability of getting an even number is the same as that of getting an odd number.
Answer:
Given:
Dice outcomes: $\{1, 2, 3, 4, 5, 6\}$
Solution:
Even numbers: $\{2, 4, 6\}$
$P(\text{Even}) = \frac{3}{6} = \frac{1}{2}$
Odd numbers: $\{1, 3, 5\}$
$P(\text{Odd}) = \frac{3}{6} = \frac{1}{2}$
Both probabilities are equal to $\frac{1}{2}$.
Answer: True (T)
Question 80. To verify pythagoras theorem is a random experiment.
Answer:
Solution:
A random experiment is an experiment where the outcome cannot be predicted with certainty before it is performed. For example, tossing a coin or rolling a dice.
Verifying Pythagoras theorem is a mathematical calculation based on a fixed law ($a^2 + b^2 = c^2$). Since the result is always predictable and fixed for any right-angled triangle, it is not a random experiment.
Answer: False (F)
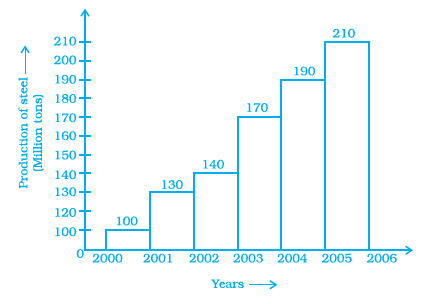
Question 81. The following pictorial representation of data is a histogram.
Answer:
Solution:
A histogram is a graphical representation of a frequency distribution for continuous data (like height, weight, or marks in intervals). The $y\text{-axis}$ in a histogram must represent the frequency (number of times an observation occurs).
In the given figure, the $x\text{-axis}$ represents discrete Years and the $y\text{-axis}$ represents the Production of steel (a quantity), not the frequency of occurrences. This is a Bar Graph where the bars happen to be placed adjacent to each other.
Answer: False (F)
Question 82 to 116
Question 82. Given below is a frequency distribution table. Read it and answer the questions that follow:
| Class Interval | Frequency |
|---|---|
| 10 - 20 | 5 |
| 20 - 30 | 10 |
| 30 - 40 | 4 |
| 40 - 50 | 15 |
| 50 - 60 | 12 |
(a) What is the lower limit of the second class interval?
(b) What is the upper limit of the last class interval?
(c) What is the frequency of the third class?
(d) Which interval has a frequency of 10?
(e) Which interval has the lowest frequency?
(f) What is the class size?
Answer:
(a) Solution:
The second class interval is $20 - 30$.
Lower Limit = $20$
(b) Solution:
The last class interval is $50 - 60$.
Upper Limit = $60$
(c) Solution:
The third class interval is $30 - 40$. Looking at the frequency column:
Frequency = $4$
(d) Solution:
From the table, the frequency '$10$' corresponds to the class interval:
Interval = $20 - 30$
(e) Solution:
Comparing all frequencies ($5, 10, 4, 15, 12$), the lowest frequency is $4$. This corresponds to the interval:
Interval = $30 - 40$
(f) Solution:
Class size is the difference between the upper limit and the lower limit of any interval.
$\text{Class size} = 20 - 10$
Class size = $10$
Question 83. The top speeds of thirty different land animals have been organised into a frequency table. Draw a histogram for the given data.
| Maximum Speed (km/h) | Frequency |
|---|---|
| 10 - 20 | 5 |
| 20 - 30 | 5 |
| 30 - 40 | 10 |
| 40 - 50 | 8 |
| 50 - 60 | 0 |
| 60 - 70 | 2 |
Answer:
Solution:
To draw the histogram, we follow these steps:
1. Represent Maximum Speed ($in$ km/h) on the horizontal axis ($x\text{-axis}$). Since the data starts from $10$, we can use a "kink" or "zig-zag" line near the origin if needed, but here we can start directly from $0$ with equal intervals.
2. Represent Frequency on the vertical axis ($y\text{-axis}$).
3. Draw rectangles with width equal to the class interval ($10$) and height equal to the corresponding frequency.
4. Note that for the interval $50 - 60$, the frequency is $0$, so there will be no bar (a gap in heights) at that position.
In the graph above:
The $x\text{-axis}$ scale is $1$ unit = $10$ km/h.
The $y\text{-axis}$ scale is $1$ unit = $2$ animals.
Question 84. Given below is a pie chart showing the time spend by a group of 350 children in different games. Observe it and answer the questions that follow.
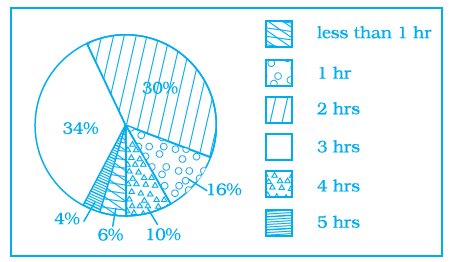
(a) How many children spend at least one hour in playing games?
(b) How many children spend more than 2 hours in playing games?
(c) How many children spend 3 or lesser hours in playing games?
(d) Which is greater — number of children who spend 2 hours or more per day or number of children who play for less than one hour?
Answer:
Given:
Total number of children = $350$
From the pie chart, the percentages of children spending time are:
$\bullet$ Less than 1 hr = $6\%$
$\bullet$ 1 hr = $16\%$
$\bullet$ 2 hrs = $30\%$
$\bullet$ 3 hrs = $34\%$
$\bullet$ 4 hrs = $10\%$
$\bullet$ 5 hrs = $4\%$
(a) To find the number of children who spend at least one hour:
"At least one hour" means 1 hour or more. This includes the categories: 1 hr, 2 hrs, 3 hrs, 4 hrs, and 5 hrs.
$\text{Total percentage} = 16\% + 30\% + 34\% + 10\% + 4\% = 94\%$
Alternatively, $\text{Total percentage} = 100\% - 6\% (\text{less than 1 hr}) = 94\%$
$\text{Number of children} = \frac{94}{100} \times 350 = 329$
Ans: 329 children
(b) To find the number of children who spend more than 2 hours:
"More than 2 hours" includes the categories: 3 hrs, 4 hrs, and 5 hrs.
$\text{Total percentage} = 34\% + 10\% + 4\% = 48\%$
$\text{Number of children} = \frac{48}{100} \times 350 = 168$
Ans: 168 children
(c) To find the number of children who spend 3 or lesser hours:
"3 or lesser hours" includes the categories: Less than 1 hr, 1 hr, 2 hrs, and 3 hrs.
$\text{Total percentage} = 6\% + 16\% + 30\% + 34\% = 86\%$
$\text{Number of children} = \frac{86}{100} \times 350 = 301$
Ans: 301 children
(d) Comparison of groups:
Group 1: Children who spend 2 hours or more
Categories included: 2 hrs, 3 hrs, 4 hrs, 5 hrs.
$\text{Percentage} = 30\% + 34\% + 10\% + 4\% = 78\%$
Group 2: Children who play for less than one hour
Category included: Less than 1 hr.
$\text{Percentage} = 6\%$
Comparing the two groups: $78\% > 6\%$ ($273\text{ children vs } 21\text{ children}$).
Ans: The number of children who spend 2 hours or more per day is greater.
Question 85. The pie chart on the right shows the result of a survey carried out to find the modes of travel used by the children to go to school. Study the pie chart and answer the questions that follow.
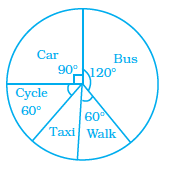
(a) What is the most common mode of transport?
(b) What fraction of children travel by car?
(c) If 18 children travel by car, how many children took part in the survey?
(d) How many children use taxi to travel to school?
(e) By which two modes of transport are equal number of children travelling?
Answer:
Given:
Central angles from the chart:
$\text{Bus} = 120^\circ$
$\text{Car} = 90^\circ$
$\text{Cycle} = 60^\circ$
$\text{Walk} = 60^\circ$
Solution (a):
The most common mode is represented by the largest central angle.
$\text{Bus} (120^\circ)$ has the largest angle. Hence, Bus is the most common mode.
Solution (b):
$\text{Fraction} = \frac{\text{Central Angle of Car}}{360^\circ}$
$\text{Fraction} = \frac{\cancel{90}^1}{\cancel{360}_4} = \frac{1}{4}$
Solution (c):
Let the total number of children be $x$.
$\text{Children by car} = \text{Fraction} \times x$
$18 = \frac{1}{4} \times x$
$x = 18 \times 4 = 72$
So, 72 children took part in the survey.
Solution (d):
First, find the central angle for Taxi:
$\text{Taxi angle} = 360^\circ - (120^\circ + 90^\circ + 60^\circ + 60^\circ)$
$\text{Taxi angle} = 360^\circ - 330^\circ = 30^\circ$
$\text{Number of children using taxi} = \frac{30^\circ}{360^\circ} \times 72$
$\text{Number} = \frac{1}{12} \times 72 = 6$ children.
Solution (e):
Equal numbers travel by modes with the same central angle.
Cycle ($60^\circ$) and Walk ($60^\circ$) have equal angles.
Question 86. A dice is rolled once. What is the probability that the number on top will be
(a) Odd
(b) Greater than 5
(c) A multiple of 3
(d) Less than 1
(e) A factor of 36
(f) A factor of 6
Answer:
Given:
Total possible outcomes on a dice: $S = \{1, 2, 3, 4, 5, 6\}$
Total number of outcomes = $6$
Solution (a):
Odd numbers = $\{1, 3, 5\}$; Favorable outcomes = $3$
$P(\text{Odd}) = \frac{3}{6} = \frac{1}{2}$
Solution (b):
Numbers greater than 5 = $\{6\}$; Favorable outcomes = $1$
$P(\text{Greater than 5}) = \frac{1}{6}$
Solution (c):
Multiples of 3 = $\{3, 6\}$; Favorable outcomes = $2$
$P(\text{Multiple of 3}) = \frac{2}{6} = \frac{1}{3}$
Solution (d):
Numbers less than 1 = $\emptyset$; Favorable outcomes = $0$
$P(\text{Less than 1}) = \frac{0}{6} = 0$
Solution (e):
Factors of 36 in the set = $\{1, 2, 3, 4, 6\}$; Favorable outcomes = $5$
$P(\text{Factor of 36}) = \frac{5}{6}$
Solution (f):
Factors of 6 in the set = $\{1, 2, 3, 6\}$; Favorable outcomes = $4$
$P(\text{Factor of 6}) = \frac{4}{6} = \frac{2}{3}$
Question 87. Classify the following statements under appropriate headings.
(a) Getting the sum of angles of a triangle as 180°.
(b) India winning a cricket match against Pakistan.
(c) Sun setting in the evening.
(d) Getting 7 when a die is thrown.
(e) Sun rising from the west.
(f) Winning a racing competition by you.
| Certain to happen | Impossible to happen | May or may not happen |
|---|---|---|
Answer:
Solution:
| Certain to happen | Impossible to happen | May or may not happen |
| (a) Angle sum of triangle as $180^\circ$. | (d) Getting 7 on a die. | (b) India winning a cricket match. |
| (c) Sun setting in the evening. | (e) Sun rising from the west. | (f) Winning a race. |
Question 88. Study the pie chart given below depicting the marks scored by a student in an examination out of 540. Find the marks obtained by him in each subject.
Answer:
Given:
Total marks scored by the student = $540$
Total central angle of the pie chart = $360^\circ$
From the pie chart, the central angles for the subjects are:
$\bullet$ Mathematics = $120^\circ$
$\bullet$ English = $90^\circ$
$\bullet$ Hindi = $60^\circ$
$\bullet$ Science = $70^\circ$
$\bullet$ Social Science = $20^\circ$
To Find:
Marks obtained by the student in each subject.
Solution:
To find the marks obtained in each subject, we use the formula:
$\text{Marks obtained} = \frac{\text{Central angle of the subject}}{360^\circ} \times \text{Total marks}$
First, let's find the marks for $1^\circ$ of the central angle:
$\text{Marks per degree} = \frac{540}{360} = 1.5\text{ marks}$
Now, we calculate the marks for each subject:
1. Mathematics:
$\text{Marks} = 120^\circ \times 1.5 = 180$
2. English:
$\text{Marks} = 90^\circ \times 1.5 = 135$
3. Hindi:
$\text{Marks} = 60^\circ \times 1.5 = 90$
4. Science:
$\text{Marks} = 70^\circ \times 1.5 = 105$
5. Social Science:
$\text{Marks} = 20^\circ \times 1.5 = 30$
Summary of Marks:
| Subject | Central Angle | Marks Obtained |
| Mathematics | $120^\circ$ | 180 |
| English | $90^\circ$ | 135 |
| Hindi | $60^\circ$ | 90 |
| Science | $70^\circ$ | 105 |
| Social Science | $20^\circ$ | 30 |
| Total | $360^\circ$ | 540 |
Question 89. Ritwik draws a ball from a bag that contains white and yellow balls. The probability of choosing a white ball is $\frac{2}{9}$ . If the total number of balls in the bag is 36, find the number of yellow balls.
Answer:
Given:
Total number of balls in the bag = $36$
Probability of choosing a white ball, $P(\text{white}) = \frac{2}{9}$
To Find:
The number of yellow balls in the bag.
Solution:
We know that the probability of an event is given by:
$P(\text{Event}) = \frac{\text{Number of favorable outcomes}}{\text{Total number of outcomes}}$
Let the number of white balls be $x$.
$\frac{2}{9} = \frac{x}{36}$
$x = \frac{2}{\cancel{9}} \times \cancel{36}^4$
$x = 2 \times 4 = 8$
So, the number of white balls is $8$.
Now, to find the number of yellow balls, we subtract the number of white balls from the total number of balls.
$\text{Number of yellow balls} = \text{Total balls} - \text{White balls}$
$\text{Number of yellow balls} = 36 - 8$
$\text{Number of yellow balls} = 28$
Ans: 28 yellow balls
Question 90. Look at the histogram below and answer the questions that follow.
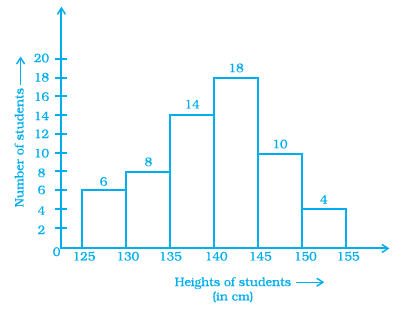
(a) How many students have height more than or equal to 135 cm but less than 150 cm?
(b) Which class interval has the least number of students?
(c) What is the class size?
(d) How many students have height less than 140 cm?
Answer:
Solution:
(a) To find students with height $\geq 135$ cm but $< 150$ cm, we add the frequencies of the class intervals $135 - 140$, $140 - 145$, and $145 - 150$.
Frequency of ($135 - 140$) = $14$
Frequency of ($140 - 145$) = $18$
Frequency of ($145 - 150$) = $10$
$\text{Total students} = 14 + 18 + 10 = 42$
(b) By observing the histogram, the bar with the lowest height represents the least number of students.
The class interval $150 - 155$ has the least frequency of $4$ students.
(c) Class size is the difference between the upper limit and lower limit of any class interval.
$\text{Class size} = 130 - 125 = 5$ cm.
(d) To find students with height less than $140$ cm, we add frequencies of class intervals $125 - 130$, $130 - 135$, and $135 - 140$.
$\text{Total students} = 6 + 8 + 14 = 28$ students.
Question 91. Following are the number of members in 25 families of a village:
| 6 | 8 | 7 | 7 | 6 | 5 | 3 | 2 | 5 | 6 |
| 8 | 7 | 7 | 4 | 3 | 6 | 6 | 6 | 7 | 5 |
| 4 | 3 | 3 | 2 | 5 |
Prepare a frequency distribution table for the data using class intervals 0 –2, 2 –4, etc.
Answer:
Given:
Data of 25 families: $6, 8, 7, 7, 6, 5, 3, 2, 5, 6, 8, 7, 7, 4, $$ 3, 6, 6, 6, 7, $$ 5, 4, 3, 3, 2, 5$
Solution:
We will organize the data into class intervals of size 2. Note: In the interval $2 - 4$, 2 is included but 4 is excluded.
| Class Interval (Members) | Tally Marks | Frequency (No. of families) |
| 0 - 2 | - | 0 |
| 2 - 4 | $\bcancel{||||}$ $|$ | 6 |
| 4 - 6 | $\bcancel{||||}$ $|$ | 6 |
| 6 - 8 | $\bcancel{||||}$ $\bcancel{||||}$ $|$ | 11 |
| 8 - 10 | $||$ | 2 |
| Total | 25 | |
Question 92. Draw a histogram to represent the frequency distribution in question 91.
Answer:
Solution:
To draw the histogram, we take the Class Intervals (Number of Members) on the $x$-axis and the Frequency (Number of Families) on the $y$-axis.
The rectangles are drawn with base as class intervals and heights equal to the respective frequencies. Since the class intervals are continuous ($0-2, 2-4, \dots$), there are no gaps between the bars.
Question 93. The marks obtained (out of 20) by 30 students of a class in a test are as follows:
| 14 | 16 | 15 | 11 | 15 | 14 | 13 | 16 | 8 | 10 |
| 7 | 11 | 18 | 15 | 14 | 19 | 20 | 7 | 10 | 13 |
| 12 | 14 | 15 | 13 | 16 | 17 | 14 | 11 | 10 | 20 |
Prepare a frequency distribution table for the above data using class intervals of equal width in which one class interval is 4 –8 (excluding 8 and including 4).
Answer:
Given:
The marks obtained by 30 students are: $14, 16, 15, 11, 15, 14, $$ 13, 16, 8, $$ 10, 7, 11, 18, 15, 14, 19, 20, 7, 10, 13, 12, 14, 15, 13, 16, 17, 14, 11, 10, 20$
One class interval is 4 – 8, where 4 is included and 8 is excluded.
Solution:
The width of the class interval is $8 - 4 = 4$.
Based on this width, the class intervals will be $4-8, 8-12, 12-16, 16-20, \text{ and } 20-24$ (to include the marks 20).
Following the continuous group frequency distribution method, the upper limit is excluded and the lower limit is included in each interval.
| Class Interval (Marks) | Tally Marks | Frequency (Number of Students) |
| 4 - 8 | $||$ | 2 |
| 8 - 12 | $\bcancel{||||} \ ||$ | 7 |
| 12 - 16 | $\bcancel{||||} \ \bcancel{||||} \ |||$ | 13 |
| 16 - 20 | $\bcancel{||||} \ |$ | 6 |
| 20 - 24 | $||$ | 2 |
| Total | 30 | |
Question 94. Prepare a histogram from the frequency distribution table obtained in question 93.
Answer:
Solution:
To represent the marks of students, we plot the Marks on the $x$-axis and the Number of Students on the $y$-axis.
Each bar's height corresponds to the frequency of students in that mark interval. A kink (zig-zag line) is used on the $x$-axis between $0$ and $4$ because the intervals start from $4$.
Question 95. The weights (in kg) of 30 students of a class are:
| 39 | 38 | 36 | 38 | 40 | 42 | 43 | 44 | 33 | 33 |
| 31 | 45 | 46 | 38 | 37 | 31 | 30 | 39 | 41 | 41 |
| 46 | 36 | 35 | 34 | 39 | 43 | 32 | 37 | 29 | 26 |
Prepare a frequency distribution table using one class interval as (30 – 35), 35 not included.
(i) Which class has the least frequency?
(ii) Which class has the maximum frequency?
Answer:
Given:
Weights of 30 students (in kg): $39, 38, 36, 38, 40, 42, 43, 44, 33, 33, $$ 31, 45, 46, 38, $$ 37, 31, 30, 39, 41, $$ 41, 46, 36, 35, 34, 39, 43, 32, 37, 29, 26$.
Solution:
The minimum weight is $26$ kg and the maximum weight is $46$ kg. We will prepare the frequency distribution table with class intervals of width $5$, starting from $25-30$.
| Class Interval (Weight in kg) | Tally Marks | Frequency (No. of Students) |
| 25 - 30 | $||$ | 2 |
| 30 - 35 | $\bcancel{||||}$ $||$ | 7 |
| 35 - 40 | $\bcancel{||||}$ $\bcancel{||||}$ $|$ | 11 |
| 40 - 45 | $\bcancel{||||}$ $||$ | 7 |
| 45 - 50 | $|||$ | 3 |
| Total | 30 | |
(i) The class having the least frequency is 25 - 30 (frequency = $2$).
(ii) The class having the maximum frequency is 35 - 40 (frequency = $11$).
Question 96. Shoes of the following brands are sold in Nov. 2007 at a shoe store. Construct a pie chart for the data.
| Brand | Number of pair of shoes sold |
|---|---|
| A | 130 |
| B | 120 |
| C | 90 |
| D | 40 |
| E | 20 |
Answer:
To Find:
Construct a pie chart representing the sale of different brands of shoes.
Solution:
First, we calculate the total number of pairs sold:
$\text{Total} = 130 + 120 + 90 + 40 + 20 = 400$
Now, we find the central angle for each brand using the formula:
$\text{Central Angle} = \frac{\text{Component Value}}{\text{Total Value}} \times 360^\circ$
| Brand | Shoes Sold | Central Angle Calculation | Central Angle |
| A | 130 | $\frac{130}{400} \times 360^\circ$ | $117^\circ$ |
| B | 120 | $\frac{120}{400} \times 360^\circ$ | $108^\circ$ |
| C | 90 | $\frac{90}{400} \times 360^\circ$ | $81^\circ$ |
| D | 40 | $\frac{40}{400} \times 360^\circ$ | $36^\circ$ |
| E | 20 | $\frac{20}{400} \times 360^\circ$ | $18^\circ$ |
The pie chart is constructed using the central angles calculated above.
Question 97. The following pie chart depicts the expenditure of a state government under different heads.
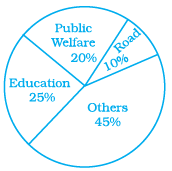
(i) If the total spending is 10 crores, how much money was spent on roads?
(ii) How many times is the amount of money spent on education compared to the amount spent on roads?
(iii) What fraction of the total expenditure is spent on both roads and public welfare together?
Answer:
Given:
Total expenditure = $\textsf{₹} 10$ crores
Percentage distribution: Public Welfare = $20\%$, Road = $10\%$, Education = $25\%$, Others = $45\%$.
Solution:
(i) Money spent on roads = $10\%$ of total spending
$\text{Amount} = \frac{10}{100} \times 10 = 1$ crore.
Ans: $\textsf{₹} 1$ crore
(ii) Percentage spent on Education = $25\%$
Percentage spent on Roads = $10\%$
$\text{Comparison} = \frac{25\%}{10\%} = 2.5$ times.
Ans: 2.5 times
(iii) Total percentage for roads and public welfare = $10\% + 20\% = 30\%$
$\text{Fraction} = \frac{30}{100} = \frac{3}{10}$
Ans: $\frac{3}{10}$
Question 98. The following data represents the different number of animals in a zoo. Prepare a pie chart for the given data.
| Animals | Number of animals |
|---|---|
| Deer | 42 |
| Elephant | 15 |
| Giraffe | 26 |
| Reptiles | 24 |
| Tiger | 13 |
Answer:
Solution:
First, find the total number of animals:
$\text{Total} = 42 + 15 + 26 + 24 + 13 = 120$
Now, calculate the central angle for each animal:
| Animals | Number | Central Angle |
| Deer | 42 | $\frac{42}{120} \times 360^\circ = 126^\circ$ |
| Elephant | 15 | $\frac{15}{120} \times 360^\circ = 45^\circ$ |
| Giraffe | 26 | $\frac{26}{120} \times 360^\circ = 78^\circ$ |
| Reptiles | 24 | $\frac{24}{120} \times 360^\circ = 72^\circ$ |
| Tiger | 13 | $\frac{13}{120} \times 360^\circ = 39^\circ$ |
Use these angles to draw the pie chart sectors.
Question 99. Playing cards
(a) From a pack of cards the following cards are kept face down:
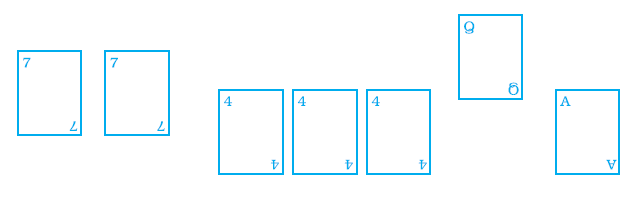
Suhail wins if he picks up a face card. Find the probability of Suhail winning?
(b) Now the following cards are added to the above cards:
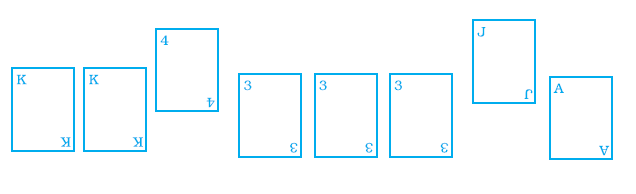
What is the probability of Suhail winning now? Reshma wins if she picks up a 4. What is the probability of Reshma winning?
[Queen, King and Jack cards are called face cards.]
Answer:
Solution (a):
From the image, the cards are: $7, 7, 4, 4, 4, \text{Queen (Q)}, \text{Ace (A)}$.
Total number of cards = $7$
Number of face cards (Q) = $1$
$\text{Probability (Suhail wins)} = \frac{\text{No. of face cards}}{\text{Total cards}} = \frac{1}{7}$
Solution (b):
Additional cards: $\text{King (K)}, \text{King (K)}, 4, 3, 3, 3, \text{Jack (J)}, \text{Ace (A)}$. (Total 8 cards added).
Total cards now = $7 + 8 = 15$
Face cards now: Q (from first set), K, K, J (from second set). Total face cards = $4$.
$\text{Probability (Suhail wins)} = \frac{4}{15}$
Now, to find Reshma's winning probability (picking a 4):
Number of 4s in total set = $3$ (from set 1) + $1$ (from set 2) = $4$.
$\text{Probability (Reshma wins)} = \frac{4}{15}$
Question 100. Construct a frequency distribution table for the following weights (in grams) of 35 mangoes, using the equal class intervals, one of them is 40 – 45 (45 not included).
| 30 | 40 | 45 | 32 | 43 | 50 | 55 | 62 | 70 | 70 |
| 61 | 62 | 53 | 52 | 50 | 42 | 35 | 37 | 53 | 55 |
| 65 | 70 | 73 | 74 | 45 | 46 | 58 | 59 | 60 | 62 |
| 74 | 34 | 35 | 70 | 68 |
(a) How many classes are there in the frequency distribution table?
(b) Which weight group has the highest frequency?
Answer:
Solution:
Minimum weight = $30$, Maximum weight = $74$. We use class size 5.
| Class Interval (Weight) | Tally Marks | Frequency |
| 30 - 35 | $|||$ | 3 |
| 35 - 40 | $|||$ | 3 |
| 40 - 45 | $|||$ | 3 |
| 45 - 50 | $|||$ | 3 |
| 50 - 55 | $\bcancel{||||}$ | 5 |
| 55 - 60 | $||||$ | 4 |
| 60 - 65 | $\bcancel{||||}$ | 5 |
| 65 - 70 | $||$ | 2 |
| 70 - 75 | $\bcancel{||||}$ $||$ | 7 |
(a) There are 9 classes in the frequency distribution table.
(b) The weight group 70 - 75 has the highest frequency ($7$).
Question 101. Complete the following table:
| Weights (in kg.) | Tally Marks | Frequency (Number of persons) |
|---|---|---|
| 40 – 50 | $\bcancel{||||} \ \bcancel{||||} \ ||$ | |
| 50 – 60 | $\bcancel{||||} \ \bcancel{||||} \ ||||$ | |
| 60 – 70 | $\bcancel{||||} \ |$ | |
| 70 – 80 | $||$ | |
| 80 – 90 | $|$ |
Find the total number of persons whose weights are given in the above table.
Answer:
Given:
A table with weight intervals and their respective tally marks.
Solution:
First, we convert the tally marks into numerical frequencies. In tally marks, $\bcancel{||||}$ represents $5$ and individual lines $|$ represent $1$.
| Weights (in kg) | Tally Marks | Frequency (No. of persons) |
|---|---|---|
| 40 – 50 | $\bcancel{||||} \ \bcancel{||||} \ ||$ | $12$ |
| 50 – 60 | $\bcancel{||||} \ \bcancel{||||} \ ||||$ | $14$ |
| 60 – 70 | $\bcancel{||||} \ |$ | $6$ |
| 70 – 80 | $||$ | $2$ |
| 80 – 90 | $|$ | $1$ |
| Total | 35 | |
The total number of persons whose weights are given is 35.
Question 102. Draw a histogram for the following data.
| Class interval | 10 - 15 | 15 - 20 | 20 - 25 | 25 - 30 | 30 - 35 | 35 - 40 |
|---|---|---|---|---|---|---|
| Frequency | 30 | 98 | 80 | 58 | 29 | 50 |
Answer:
Given:
Class intervals of equal width (5 units) and their corresponding frequencies.
Solution:
To draw the histogram:
1. Plot the Class Intervals on the $x$-axis. Since the first interval starts at 10, we can use a "kink" or "zig-zag" line near the origin to show that the scale doesn't start from zero.
2. Plot the Frequency on the $y$-axis.
3. Draw rectangles with heights corresponding to the frequency of each interval. Since the data is continuous, there are no gaps between the bars.
Scale:
$x$-axis: $1 \text{ cm} = 5 \text{ units}$
$y$-axis: $1 \text{ cm} = 10 \text{ units}$
Question 103. In a hypothetical sample of 20 people, the amount of money (in thousands of rupees) with each was found to be as follows:
| 114 | 108 | 100 | 98 | 101 | 109 | 117 | 119 | 126 | 131 |
| 136 | 143 | 156 | 169 | 182 | 195 | 207 | 219 | 235 | 118 |
Draw a histogram of the frequency distribution, taking one of the class intervals as 50–100.
Answer:
Given:
Amount of money with 20 people (in thousands of $\textsf{₹}$): $114, 108, 100, 98, $$ 101, 109, 117, 119, 126, 131, 136, 143, 156, 169, 182, 195, 207, $$ 219, 235, 118$.
To Find:
Draw a histogram with class interval size 50.
Solution:
First, we group the data into intervals of width 50:
| Class Interval (in thousand $\textsf{₹}$) | Frequencies |
|---|---|
| 50 – 100 | 1 (i.e., 98) |
| 100 – 150 | 12 |
| 150 – 200 | 4 |
| 200 – 250 | 3 |
The histogram is drawn with Money on the $x$-axis and Number of people on the $y$-axis.
Question 104. The below histogram shows the number of literate females in the age group of 10 to 40 years in a town.
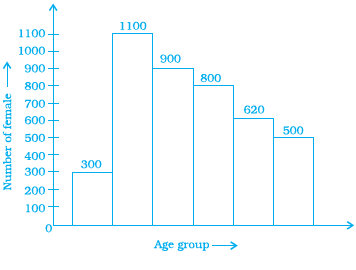
(a) Write the classes assuming all the classes are of equal width.
(b) What is the classes width?
(c) In which age group are literate females the least?
(d) In which age group is the number of literate females the highest?
Answer:
Given:
A histogram representing literate females versus age groups.
Solution:
By observing the $x$-axis and the bars of the provided histogram:
(a) The classes are: 10 – 15, 15 – 20, 20 – 25, 25 – 30, 30 – 35, 35 – 40.
(b) The class width is the difference between the limits: $15 - 10 = \mathbf{5}$ years.
(c) The shortest bar represents the least number of literate females. This corresponds to the age group 10 – 15 (Number of females = 300).
(d) The tallest bar represents the highest number of literate females. This corresponds to the age group 15 – 20 (Number of females = 1100).
Question 105. The following histogram shows the frequency distribution of teaching experiences of 30 teachers in various schools:
(a) What is the class width?
(b) How many teachers are having the maximum teaching experience and how many have the least teaching experience?
(c) How many teachers have teaching experience of 10 to 20 years?
Answer:
Solution:
Based on the standard frequency distribution for teaching experiences (usually with class intervals 0-5, 5-10, etc.):
(a) The class width is found by subtracting the lower limit from the upper limit. In a standard distribution with 30 teachers, the width is usually 5 years (e.g., $5 - 0 = 5$).
(b) Maximum teaching experience corresponds to the highest class interval (e.g., 25-30 years). Least teaching experience corresponds to the lowest class interval (e.g., 0-5 years).
Depending on the specific graph values, if 2 teachers are in 25-30 and 2 teachers are in 0-5:
Ans: 2 teachers have maximum experience and 2 teachers have least experience.
(c) To find the number of teachers with 10 to 20 years of experience, we add the frequencies of classes 10-15 and 15-20.
$\text{Total teachers} = \text{Freq}(10-15) + \text{Freq}(15-20)$
Question 106. In a district, the number of branches of different banks is given below:
| Bank | State Bank Of India | Bank of Baroda | Punjab National Bank | Canara Bank |
|---|---|---|---|---|
| Number of Branches | 30 | 17 | 15 | 10 |
Draw a pie chart for this data.
Answer:
Given:
Number of branches for 4 banks.
Solution:
First, calculate the total number of branches:
$\text{Total branches} = 30 + 17 + 15 + 10 = 72$
Now, calculate the central angle for each bank ($\text{Angle} = \frac{\text{Value}}{72} \times 360^\circ$):
| Bank | Branches | Central Angle Calculation | Central Angle |
|---|---|---|---|
| State Bank of India | 30 | $\frac{30}{72} \times 360^\circ$ | $150^\circ$ |
| Bank of Baroda | 17 | $\frac{17}{72} \times 360^\circ$ | $85^\circ$ |
| Punjab National Bank | 15 | $\frac{15}{72} \times 360^\circ$ | $75^\circ$ |
| Canara Bank | 10 | $\frac{10}{72} \times 360^\circ$ | $50^\circ$ |
The pie chart is constructed using the angles: $150^\circ, 85^\circ, 75^\circ, \text{ and } 50^\circ$.
Question 107. For the development of basic infrastructure in a district, a project of Rs 108 crore approved by Development Bank is as follows:
| Item Head | Road | Electeicity | Drinking water | Sewerage |
|---|---|---|---|---|
| Amount in crore (Rs.) | 43.2 | 16.2 | 27.00 | 21.6 |
Draw a pie chart for this data.
Answer:
Given:
Total amount approved = $\textsf{₹}$ $108$ crore
Solution:
To draw a pie chart, we first need to calculate the central angle for each item head using the formula:
$\text{Central Angle} = \frac{\text{Component Value}}{\text{Total Value}} \times 360^\circ$
| Item Head | Amount (in crore) | Calculation | Central Angle |
| Road | $43.2$ | $\frac{43.2}{108} \times 360^\circ$ | $144^\circ$ |
| Electricity | $16.2$ | $\frac{16.2}{108} \times 360^\circ$ | $54^\circ$ |
| Drinking Water | $27.0$ | $\frac{27.0}{108} \times 360^\circ$ | $90^\circ$ |
| Sewerage | $21.6$ | $\frac{21.6}{108} \times 360^\circ$ | $72^\circ$ |
| Total | $108.0$ | $360^\circ$ |
By using the calculated central angles, the pie chart can be constructed by dividing a circle into sectors of $144^\circ, 54^\circ, 90^\circ, \text{ and } 72^\circ$.
Question 108. In the time table of a school, periods allotted per week to different teaching subjects are given below:
| Subject | Hindi | English | Maths | Science | Social Science | Computer | Sanskrit |
|---|---|---|---|---|---|---|---|
| Periods Alloted | 7 | 8 | 8 | 8 | 7 | 4 | 3 |
Draw a pie chart for this data.
Answer:
Given:
Number of periods allotted per week for various subjects.
Solution:
First, calculate the total number of periods per week:
$\text{Total periods} = 7 + 8 + 8 + 8 + 7 + 4 + 3 = 45$
Now, calculate the central angle for each subject using $\frac{\text{Periods}}{45} \times 360^\circ$ (which simplifies to $\text{Periods} \times 8^\circ$):
| Subject | Periods | Central Angle |
| Hindi | $7$ | $7 \times 8^\circ = 56^\circ$ |
| English | $8$ | $8 \times 8^\circ = 64^\circ$ |
| Maths | $8$ | $8 \times 8^\circ = 64^\circ$ |
| Science | $8$ | $8 \times 8^\circ = 64^\circ$ |
| Social Science | $7$ | $7 \times 8^\circ = 56^\circ$ |
| Computer | $4$ | $4 \times 8^\circ = 32^\circ$ |
| Sanskrit | $3$ | $3 \times 8^\circ = 24^\circ$ |
| Total | 45 | $360^\circ$ |
Question 109. A survey was carried out to find the favourite beverage preferred by a certain group of young people. The following pie chart shows the findings of this survey.
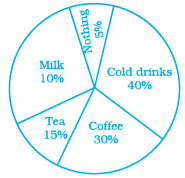
From this pie chart answer the following:
(i) Which type of beverage is liked by the maximum number of people.
(ii) If 45 people like tea, how many people were surveyed?
Answer:
Given:
Percentage distribution of beverage preferences:
$\bullet$ Cold drinks = $40\%$
$\bullet$ Coffee = $30\%$
$\bullet$ Tea = $15\%$
$\bullet$ Milk = $10\%$
$\bullet$ Nothing = $5\%$
Solution (i):
By observing the pie chart, Cold drinks has the highest percentage ($40\%$).
Ans: Cold drinks
Solution (ii):
Let the total number of people surveyed be $x$.
As per the chart, people who like tea = $15\%$ of total people.
$\frac{15}{100} \times x = 45$
$x = 45 \times \frac{100}{15}$
$x = 3 \times 100 = 300$
Ans: 300 people
Question 110. The following data represents the approximate percentage of water in various oceans. Prepare a pie chart for the given data.
Pacific
Atlantic
Indian
Others
40%
30%
20%
10%
Answer:
To Find:
Construct a pie chart based on the given ocean water percentages.
Solution:
We convert the percentages into central angles by using $\frac{\text{Percentage}}{100} \times 360^\circ$:
| Ocean | Percentage | Central Angle |
| Pacific | $40\%$ | $0.40 \times 360^\circ = 144^\circ$ |
| Atlantic | $30\%$ | $0.30 \times 360^\circ = 108^\circ$ |
| Indian | $20\%$ | $0.20 \times 360^\circ = 72^\circ$ |
| Others | $10\%$ | $0.10 \times 360^\circ = 36^\circ$ |
Question 111. At a Birthday Party, the children spin a wheel to get a gift. Find the probability of
(a) getting a ball
(b) getting a toy car
(c) any toy except a chocolate
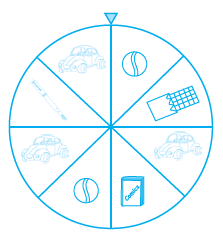
Answer:
Given:
Observing the spinning wheel, there are $8$ equal sectors. The gifts are:
1. Pen, 2. Toy car, 3. Ball, 4. Chocolate, 5. Toy car, 6. Comics, 7. Ball, 8. Toy car.
Total number of outcomes = $8$
Solution (a):
Number of sectors having a ball = $2$
$P(\text{getting a ball}) = \frac{2}{8} = \frac{1}{4}$
Solution (b):
Number of sectors having a toy car = $3$
$P(\text{getting a toy car}) = \frac{3}{8}$
Solution (c):
"Any toy except a chocolate" means everything except the chocolate sector.
Number of favorable outcomes = $8 - 1 = 7$
$P(\text{any toy except a chocolate}) = \frac{7}{8}$
Question 112. Sonia picks up a card from the given cards.
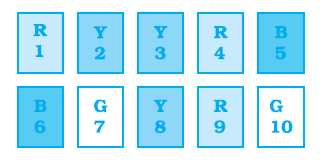
Calculate the probability of getting
(a) an odd number
(b) a Y card
(c) a G card
(d) B card bearing number > 7
Answer:
Given:
The set of cards is: $\{R1, Y2, Y3, R4, B5, B6, G7, Y8, R9, G10\}$
Total number of outcomes (cards) = $10$
Solution:
(a) Probability of getting an odd number:
Odd numbered cards are: $1, 3, 5, 7, 9$
Number of favorable outcomes = $5$
$P(\text{Odd}) = \frac{5}{10} = \frac{1}{2}$
(b) Probability of getting a Y (Yellow) card:
Y cards are: $Y2, Y3, Y8$
Number of favorable outcomes = $3$
$P(\text{Y card}) = \frac{3}{10}$
(c) Probability of getting a G (Green) card:
G cards are: $G7, G10$
Number of favorable outcomes = $2$
$P(\text{G card}) = \frac{2}{10} = \frac{1}{5}$
(d) Probability of getting a B (Blue) card bearing number $> 7$:
B cards in the set are: $B5, B6$
Since none of the B cards have a number greater than 7, the number of favorable outcomes = $0$
$P(\text{B card } > 7) = \frac{0}{10} = 0$
Question 113. Identify which symbol should appear in each sector in 113, 114.
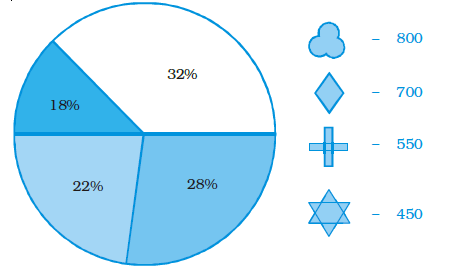
Answer:
Given:
Percentages: $32\%, 28\%, 22\%, 18\%$
Values: $800, 700, 550, 450$
Solution:
First, we find the total value: $800 + 700 + 550 + 450 = 2500$
Now, let's match the values to the percentages by calculating the percentage of each value:
1. For $800$: $\frac{800}{2500} \times 100 = 32\%$
2. For $700$: $\frac{700}{2500} \times 100 = 28\%$
3. For $550$: $\frac{550}{2500} \times 100 = 22\%$
4. For $450$: $\frac{450}{2500} \times 100 = 18\%$
Final Identification:
$\bullet$ The Cloud symbol (800) belongs to the 32% sector.
$\bullet$ The Diamond symbol (700) belongs to the 28% sector.
$\bullet$ The Plus symbol (550) belongs to the 22% sector.
$\bullet$ The Star symbol (450) belongs to the 18% sector.
Question 114.
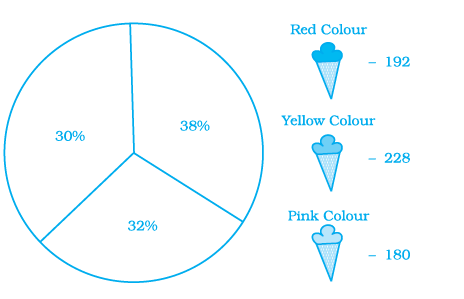
Answer:
Given:
Percentages: $38\%, 32\%, 30\%$
Values: $228, 192, 180$
Solution:
Total ice cream sales = $228 + 192 + 180 = 600$
Calculating the percentage for each value:
1. For 228 (Yellow Colour): $\frac{228}{600} \times 100 = 38\%$
2. For 192 (Red Colour): $\frac{192}{600} \times 100 = 32\%$
3. For 180 (Pink Colour): $\frac{180}{600} \times 100 = 30\%$
Final Identification:
$\bullet$ Yellow Colour (228) belongs to the 38% sector.
$\bullet$ Red Colour (192) belongs to the 32% sector.
$\bullet$ Pink Colour (180) belongs to the 30% sector.
Question 115. A financial counselor gave a client this pie chart describing how to budget his income. If the client brings home Rs. 50,000 each month, how much should he spend in each category?
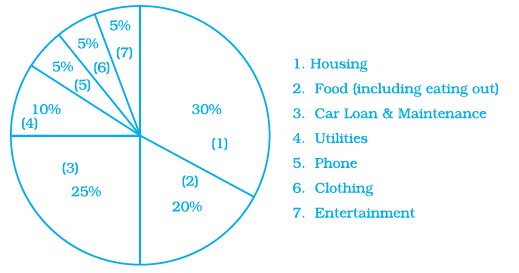
Answer:
Given:
Total Monthly Income = $\textsf{₹} 50,000$
Solution:
We calculate the amount for each category by multiplying the total income by the respective percentage:
| Category | Percentage | Amount (in $\textsf{₹}$) |
|---|---|---|
| 1. Housing | 30% | $\frac{30}{100} \times 50000 = 15,000$ |
| 2. Food | 20% | $\frac{20}{100} \times 50000 = 10,000$ |
| 3. Car Loan & Maintenance | 25% | $\frac{25}{100} \times 50000 = 12,500$ |
| 4. Utilities | 10% | $\frac{10}{100} \times 50000 = 5,000$ |
| 5. Phone | 5% | $\frac{5}{100} \times 50000 = 2,500$ |
| 6. Clothing | 5% | $\frac{5}{100} \times 50000 = 2,500$ |
| 7. Entertainment | 5% | $\frac{5}{100} \times 50000 = 2,500$ |
| Total | $\textsf{₹} 50,000$ | |
Question 116. Following is a pie chart showing the amount spent in rupees (in thousands) by a company on various modes of advertising for a product.
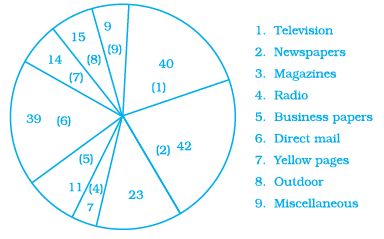
Now answer the following questions.
1. Which type of media advertising is the greatest amount of the total?
2. Which type of media advertising is the least amount of the total?
3. What per cent of the total advertising amount is spent on direct mail campaigns?
4. What per cent of the advertising amount is spent on newspaper and magazine advertisements?
5. What media types do you think are included in miscellaneous? Why aren’t those media types given their own category?
Answer:
Given:
Expenditure amounts (in thousands of $\textsf{₹}$):
1. Television = 40, 2. Newspapers = 42, 3. Magazines = 23, 4. Radio = 7, 5. Business papers = 11, 6. Direct mail = 39, 7. Yellow pages = 14, 8. Outdoor = 15, 9. Miscellaneous = 9.
Solution:
First, find the total advertising expenditure:
$\text{Total} = 40 + 42 + 23 + 7 + 11 + 39 + 14 + 15 + 9 = 200$ thousand $\textsf{₹}$.
1. Greatest amount:
The highest value in the chart is 42, which corresponds to Newspapers.
2. Least amount:
The lowest value in the chart is 7, which corresponds to Radio.
3. Per cent on Direct Mail:
$\text{Percentage} = \frac{\text{Amount on Direct Mail}}{\text{Total Amount}} \times 100$
$\text{Percentage} = \frac{39}{200} \times 100 = 19.5\%$
4. Per cent on Newspapers and Magazines:
Total amount for Newspaper and Magazine = $42 + 23 = 65$
$\text{Percentage} = \frac{65}{200} \times 100 = 32.5\%$
5. Miscellaneous Category:
Miscellaneous may include advertising via social media, internet pop-ups, sponsorships, or pamphlets. These are not given separate categories because their individual spending is too small to be represented clearly as a major sector in the pie chart.